
 Events
 Latest images
Trump prošao pokraj buduće nobelovke za mir kao pokraj turskog groblja
Page 9 of 12 •  1, 2, 3 ... 8, 9, 10, 11, 12
 ![]()

Re: Trump prošao pokraj buduće nobelovke za mir kao pokraj turskog groblja
 by Hektorović Tue 24 Sep - 21:57
melkior wrote:Emančipiranu ju izignorirao Trump. Arhetipski neprijatelji se susreli na brvnu. Makar, žao mi je klinke, ona barem ima ideale.RayMabus wrote:
Baš je simpa.


Ma Trump je nije niti vidio ... ova je bila u kutu popunjenog hodnika na jedino 10 metara udaljenost
Hektorović- Posts : 26373
2018-04-10

Re: Trump prošao pokraj buduće nobelovke za mir kao pokraj turskog groblja
by prckov Tue 24 Sep - 21:58
sigurno ne prati medije pa brblja bezveze

_________________
It was always the women, and above all the young ones, who were the most bigotet adherents of the party, the swallowers of slogans, the amateur spies and nosers-out of unortodoxy.
Orwell 1984

prckov- Posts : 34555
2014-04-18
Re: Trump prošao pokraj buduće nobelovke za mir kao pokraj turskog groblja
by Noor Tue 24 Sep - 21:59
a na što ide onaj vlak?! jel i to na solarnu energiju ko i brod s kojim je putovala u NY?!prckov wrote:samo da se djeci oduzme mobitele koliko bi se ustedilo na struji a time I na potrosnji gorivaNoor wrote:ovakve kabanice su stvarno neuništive, ja je imam vise od 20 godina, mora bit neka visokokvalitetna plastika
kako su strastveni u vezi klime sigurno bi odma pristali


_________________
It's So Good To Be Bad

Noor- Posts : 25907
2017-10-06
Re: Trump prošao pokraj buduće nobelovke za mir kao pokraj turskog groblja
by prckov Tue 24 Sep - 22:03
ma sve je to cirkusNoor wrote:a na što ide onaj vlak?! jel i to na solarnu energiju ko i brod s kojim je putovala u NY?!prckov wrote:samo da se djeci oduzme mobitele koliko bi se ustedilo na struji a time I na potrosnji gorivaNoor wrote:ovakve kabanice su stvarno neuništive, ja je imam vise od 20 godina, mora bit neka visokokvalitetna plastika
kako su strastveni u vezi klime sigurno bi odma pristali
manipulacija
bar da je vaginalna a ne klimatska pa da covjek I nasjedne
vako ko melki
prckov- Posts : 34555
2014-04-18
Re: Trump prošao pokraj buduće nobelovke za mir kao pokraj turskog groblja
by melkior Tue 24 Sep - 22:05
Global Warming of 1.5 ºC
An IPCC special report on the impacts of global warming of 1.5 °C above pre-industrial levels and related global greenhouse gas emission pathways, in the context of strengthening the global response to the threat of climate change, sustainable development, and efforts to eradicate poverty.
Chapter 1
Executive Summary
This chapter frames the context, knowledge-base and assessment approaches used to understand the impacts of 1.5°C global warming above pre-industrial levels and related global greenhouse gas emission pathways, building on the IPCC Fifth Assessment Report (AR5), in the context of strengthening the global response to the threat of climate change, sustainable development and efforts to eradicate poverty.
Human-induced warming reached approximately 1°C (likely between 0.8°C and 1.2°C) above pre-industrial levels in 2017, increasing at 0.2°C (likely between 0.1°C and 0.3°C) per decade (high confidence). Global warming is defined in this report as an increase in combined surface air and sea surface temperatures averaged over the globe and over a 30-year period. Unless otherwise specified, warming is expressed relative to the period 1850–1900, used as an approximation of pre-industrial temperatures in AR5. For periods shorter than 30 years, warming refers to the estimated average temperature over the 30 years centred on that shorter period, accounting for the impact of any temperature fluctuations or trend within those 30 years. Accordingly, warming from pre- industrial levels to the decade 2006–2015 is assessed to be 0.87°C (likely between 0.75°C and 0.99°C). Since 2000, the estimated level of human-induced warming has been equal to the level of observed warming with a likely range of ±20% accounting for uncertainty due to contributions from solar and volcanic activity over the historical period (high confidence). {1.2.1}
Warming greater than the global average has already been experienced in many regions and seasons, with higher average warming over land than over the ocean (high confidence). Most land regions are experiencing greater warming than the global average, while most ocean regions are warming at a slower rate. Depending on the temperature dataset considered, 20–40% of the global human population live in regions that, by the decade 2006–2015, had already experienced warming of more than 1.5°C above pre-industrial in at least one season (medium confidence). {1.2.1, 1.2.2}
Past emissions alone are unlikely to raise global-mean temperature to 1.5°C above pre-industrial levels (medium confidence), but past emissions do commit to other changes, such as further sea level rise (high confidence). If all anthropogenic emissions (including aerosol-related) were reduced to zero immediately, any further warming beyond the 1°C already experienced would likely be less than 0.5°C over the next two to three decades (high confidence), and likely less than 0.5°C on a century time scale (medium confidence), due to the opposing effects of different climate processes and drivers. A warming greater than 1.5°C is therefore not geophysically unavoidable: whether it will occur depends on future rates of emission reductions. {1.2.3, 1.2.4}
1.5°C emission pathways are defined as those that, given current knowledge of the climate response, provide a one- in-two to two-in-three chance of warming either remaining below 1.5°C or returning to 1.5°C by around 2100 following an overshoot. Overshoot pathways are characterized by the peak magnitude of the overshoot, which may have implications for impacts. All 1.5°C pathways involve limiting cumulative emissions of long-lived greenhouse gases, including carbon dioxide and nitrous oxide, and substantial reductions in other climate forcers (high confidence). Limiting cumulative emissions requires either reducing net global emissions of long-lived greenhouse gases to zero before the cumulative limit is reached, or net negative global emissions (anthropogenic removals) after the limit is exceeded. {1.2.3, 1.2.4, Cross-Chapter Boxes 1 and 2}
This report assesses projected impacts at a global average warming of 1.5°C and higher levels of warming. Global warming of 1.5°C is associated with global average surface temperatures fluctuating naturally on either side of 1.5°C, together with warming substantially greater than 1.5°C in many regions and seasons (high confidence), all of which must be considered in the assessment of impacts. Impacts at 1.5°C of warming also depend on the emission pathway to 1.5°C. Very different impacts result from pathways that remain below 1.5°C versus pathways that return to 1.5°C after a substantial overshoot, and when temperatures stabilize at 1.5°C versus a transient warming past 1.5°C (medium confidence). {1.2.3, 1.3}
Ethical considerations, and the principle of equity in particular, are central to this report, recognizing that many of the impacts of warming up to and beyond 1.5°C, and some potential impacts of mitigation actions required to limit warming to 1.5°C, fall disproportionately on the poor and vulnerable (high confidence). Equity has procedural and distributive dimensions and requires fairness in burden sharing both between generations and between and within nations. In framing the objective of holding the increase in the global average temperature rise to well below 2°C above pre-industrial levels, and to pursue efforts to limit warming to 1.5°C, the Paris Agreement associates the principle of equity with the broader goals of poverty eradication and sustainable development, recognising that effective responses to climate change require a global collective effort that may be guided by the 2015 United Nations Sustainable Development Goals. {1.1.1}
Climate adaptation refers to the actions taken to manage impacts of climate change by reducing vulnerability and exposure to its harmful effects and exploiting any potential benefits. Adaptation takes place at international, national and local levels. Subnational jurisdictions and entities, including urban and rural municipalities, are key to developing and reinforcing measures for reducing weather- and climate-related risks. Adaptation implementation faces several barriers including lack of up-to-date and locally relevant information, lack of finance and technology, social values and attitudes, and institutional constraints (high confidence). Adaptation is more likely to contribute to sustainable development when policies align with mitigation and poverty eradication goals (medium confidence). {1.1, 1.4}
Ambitious mitigation actions are indispensable to limit warming to 1.5°C while achieving sustainable development and poverty eradication (high confidence). Ill-designed responses, however, could pose challenges especially – but not exclusively – for countries and regions contending with poverty and those requiring significant transformation of their energy systems. This report focuses on ‘climate-resilient development pathways’, which aim to meet the goals of sustainable development, including climate adaptation and mitigation, poverty eradication and reducing inequalities. But any feasible pathway that remains within 1.5°C involves synergies and trade-offs (high confidence). Significant uncertainty remains as to which pathways are more consistent with the principle of equity.
{1.1.1, 1.4}
Multiple forms of knowledge, including scientific evidence, narrative scenarios and prospective pathways, inform the understanding of 1.5°C. This report is informed by traditional evidence of the physical climate system and associated impacts and vulnerabilities of climate change, together with knowledge drawn from the perceptions of risk and the experiences of climate impacts and governance systems. Scenarios and pathways are used to explore conditions enabling goal-oriented futures while recognizing the significance of ethical considerations, the principle of equity, and the societal transformation needed. {1.2.3, 1.5.2}
There is no single answer to the question of whether it is feasible to limit warming to 1.5°C and adapt to the consequences. Feasibility is considered in this report as the capacity of a system as a whole to achieve a specific outcome. The global transformation that would be needed to limit warming to 1.5°C requires enabling conditions that reflect the links, synergies and trade-offs between mitigation, adaptation and sustainable development. These enabling conditions are assessed across many dimensions of feasibility – geophysical, environmental-ecological, technological, economic, socio-cultural and institutional – that may be considered through the unifying lens of the Anthropocene, acknowledging profound, differential but increasingly geologically significant human influences on the Earth system as a whole. This framing also emphasises the global interconnectivity of past, present and future human–environment relations, highlighting the need and opportunities for integrated responses to achieve the goals of the Paris Agreement. {1.1, Cross-Chapter Box 1}
……………………………………………………...
Introduction
Share- [url=https://twitter.com/intent/tweet?text=Introduction %E2%80%94 Summary for Policymakers %E2%80%94 Global Warming of 1.5 %C2%BAC via %40ipcc_ch%3A https%3A%2F%2Fwww.ipcc.ch%2Fsr15%2Fchapter%2Fspm%2Fspm-introduction%2F]Twitter[/url]
- Facebook
- Copy Permalink
This Report responds to the invitation for IPCC ‘… to provide a Special Report in 2018 on the impacts of global warming of 1.5°C above pre-industrial levels and related global greenhouse gas emission pathways’ contained in the Decision of the 21st Conference of Parties of the United Nations Framework Convention on Climate Change to adopt the Paris Agreement
.
The IPCC accepted the invitation in April 2016, deciding to prepare this Special Report on the impacts of global warming of 1.5°C above pre-industrial levels and related global greenhouse gas emission pathways, in the context of strengthening the global response to the threat of climate change, sustainable development, and efforts to eradicate poverty.
This Summary for Policymakers (SPM) presents the key findings of the Special Report, based on the assessment of the available scientific, technical and socio-economic literature
relevant to global warming of 1.5°C and for the comparison between global warming of 1.5°C and 2°C above pre-industrial levels. The level of confidence associated with each key finding is reported using the IPCC calibrated language
. The underlying scientific basis of each key finding is indicated by references provided to chapter elements. In the SPM, knowledge gaps are identified associated with the underlying chapters of the Report.
https://www.ipcc.ch/sr15/

melkior- Posts : 17503
2015-08-09
Re: Trump prošao pokraj buduće nobelovke za mir kao pokraj turskog groblja
by melkior Tue 24 Sep - 22:06
Baš naprotiv, izvješća govore da će zbog klimatskih promjena najviše stradati sirotinja.prckov wrote:cuj ovog nevjernika melki
sigurno ne prati medije pa brblja bezveze
melkior- Posts : 17503
2015-08-09
Re: Trump prošao pokraj buduće nobelovke za mir kao pokraj turskog groblja
by prckov Tue 24 Sep - 22:09
ej nemoj vise lijepit te ponjave za pranje mekanih mozgovamelkior wrote:Baš naprotiv, izvješća govore da će zbog klimatskih promjena najviše stradati sirotinja.prckov wrote:cuj ovog nevjernika melki
sigurno ne prati medije pa brblja bezveze
to ja samo preskocim
I prestani bit naivan ispadas glup
prckov- Posts : 34555
2014-04-18
Re: Trump prošao pokraj buduće nobelovke za mir kao pokraj turskog groblja
by melkior Tue 24 Sep - 22:14
Ch 00
Summary for Policymakers
Introduction
Share- [url=https://twitter.com/intent/tweet?text=Introduction %E2%80%94 Summary for Policymakers %E2%80%94 Global Warming of 1.5 %C2%BAC via %40ipcc_ch%3A https%3A%2F%2Fwww.ipcc.ch%2Fsr15%2Fchapter%2Fspm%2Fspm-introduction%2F]Twitter[/url]
- Facebook
- Copy Permalink
This Report responds to the invitation for IPCC ‘… to provide a Special Report in 2018 on the impacts of global warming of 1.5°C above pre-industrial levels and related global greenhouse gas emission pathways’ contained in the Decision of the 21st Conference of Parties of the United Nations Framework Convention on Climate Change to adopt the Paris Agreement
.
The IPCC accepted the invitation in April 2016, deciding to prepare this Special Report on the impacts of global warming of 1.5°C above pre-industrial levels and related global greenhouse gas emission pathways, in the context of strengthening the global response to the threat of climate change, sustainable development, and efforts to eradicate poverty.
This Summary for Policymakers (SPM) presents the key findings of the Special Report, based on the assessment of the available scientific, technical and socio-economic literature
relevant to global warming of 1.5°C and for the comparison between global warming of 1.5°C and 2°C above pre-industrial levels. The level of confidence associated with each key finding is reported using the IPCC calibrated language
. The underlying scientific basis of each key finding is indicated by references provided to chapter elements. In the SPM, knowledge gaps are identified associated with the underlying chapters of the Report.
Box SPM.1 Core Concepts Central to this report
A.1. Human activities are estimated to have caused approximately 1.0°C of global warming
above pre-industrial levels, with a likely range of 0.8°C to 1.2°C. Global warming is likely to reach 1.5°C between 2030 and 2052 if it continues to increase at the current rate. (high confidence) (Figure SPM.1) {1.2}
A.1.1. Reflecting the long-term warming trend since pre-industrial times, observed global mean surface temperature (GMST) for the decade 2006–2015 was 0.87°C (likely between 0.75°C and 0.99°C)
higher than the average over the 1850–1900 period (very high confidence). Estimated anthropogenic global warming matches the level of observed warming to within ±20% (likely range). Estimated anthropogenic global warming is currently increasing at 0.2°C (likely between 0.1°C and 0.3°C) per decade due to past and ongoing emissions (high confidence). {1.2.1, Table 1.1, 1.2.4}
A.1.2. Warming greater than the global annual average is being experienced in many land regions and seasons, including two to three times higher in the Arctic. Warming is generally higher over land than over the ocean. (high confidence) {1.2.1, 1.2.2, Figure 1.1, Figure 1.3, 3.3.1, 3.3.2}
A.1.3. Trends in intensity and frequency of some climate and weather extremes have been detected over time spans during which about 0.5°C of global warming occurred (medium confidence). This assessment is based on several lines of evidence, including attribution studies for changes in extremes since 1950. {3.3.1, 3.3.2, 3.3.3}
A.2. Warming from anthropogenic emissions from the pre-industrial period to the present will persist for centuries to millennia and will continue to cause further long-term changes in the climate system, such as sea level rise, with associated impacts (high confidence), but these emissions alone are unlikely to cause global warming of 1.5°C (medium confidence). (Figure SPM.1) {1.2, 3.3, Figure 1.5}
A.2.1. Anthropogenic emissions (including greenhouse gases, aerosols and their precursors) up to the present are unlikely to cause further warming of more than 0.5°C over the next two to three decades (high confidence) or on a century time scale (medium confidence). {1.2.4, Figure 1.5}
A.2.2. Reaching and sustaining net zero global anthropogenic CO2 emissions and declining net non-CO2 radiative forcing would halt anthropogenic global warming on multi-decadal times cales (high confidence). The maximum temperature reached is then determined by cumulative net global anthropogenic CO2 emissions up to the time of net zero CO2 emissions (high confidence) and the level of non-CO2 radiative forcing in the decades prior to the time that maximum temperatures are reached (medium confidence). On longer time scales, sustained net negative global anthropogenic CO2 emissions and/or further reductions in non-CO2 radiative forcing may still be required to prevent further warming due to Earth system feedbacks and to reverse ocean acidification (medium confidence) and will be required to minimize sea level rise (high confidence). {Cross-Chapter Box 2 in Chapter 1, 1.2.3, 1.2.4, Figure 1.4, 2.2.1, 2.2.2, 3.4.4.8, 3.4.5.1, 3.6.3.2}
A.3. Climate-related risks for natural and human systems are higher for global warming of 1.5°C than at present, but lower than at 2°C (high confidence). These risks depend on the magnitude and rate of warming, geographic location, levels of development and vulnerability, and on the choices and implementation of adaptation and mitigation options (high confidence). (Figure SPM.2) {1.3, 3.3, 3.4, 5.6}
A.3.1. Impacts on natural and human systems from global warming have already been observed (high confidence). Many land and ocean ecosystems and some of the services they provide have already changed due to global warming (high confidence). (Figure SPM.2) {1.4, 3.4, 3.5}
A.3.2. Future climate-related risks depend on the rate, peak and duration of warming. In the aggregate, they are larger if global warming exceeds 1.5°C before returning to that level by 2100 than if global warming gradually stabilizes at 1.5°C, especially if the peak temperature is high (e.g., about 2°C) (high confidence). Some impacts may be long-lasting or irreversible, such as the loss of some ecosystems (high confidence). {3.2, 3.4.4, 3.6.3, Cross-Chapter Box 8 in Chapter 3}
A.3.3. Adaptation and mitigation are already occurring (high confidence). Future climate-related risks would be reduced by the upscaling and acceleration of far-reaching, multilevel and cross-sectoral climate mitigation and by both incremental and transformational adaptation (high confidence). {1.2, 1.3, Table 3.5, 4.2.2, Cross-Chapter Box 9 in Chapter 4, Box 4.2, Box 4.3, Box 4.6, 4.3.1, 4.3.2, 4.3.3, 4.3.4, 4.3.5, 4.4.1, 4.4.4, 4.4.5, 4.5.3}
Figure SPM.1
HDSD
Download
Share
- [url=https://twitter.com/intent/tweet?text= %E2%80%94 Summary for Policymakers %E2%80%94 Global Warming of 1.5 %C2%BAC via %40ipcc_ch%3A https%3A%2F%2Fwww.ipcc.ch%2Fsr15%2Fchapter%2Fspm%2Fspm-a%2Fspm1_figure-final-2%2F]Twitter[/url]
- Facebook
- Copy Permalink
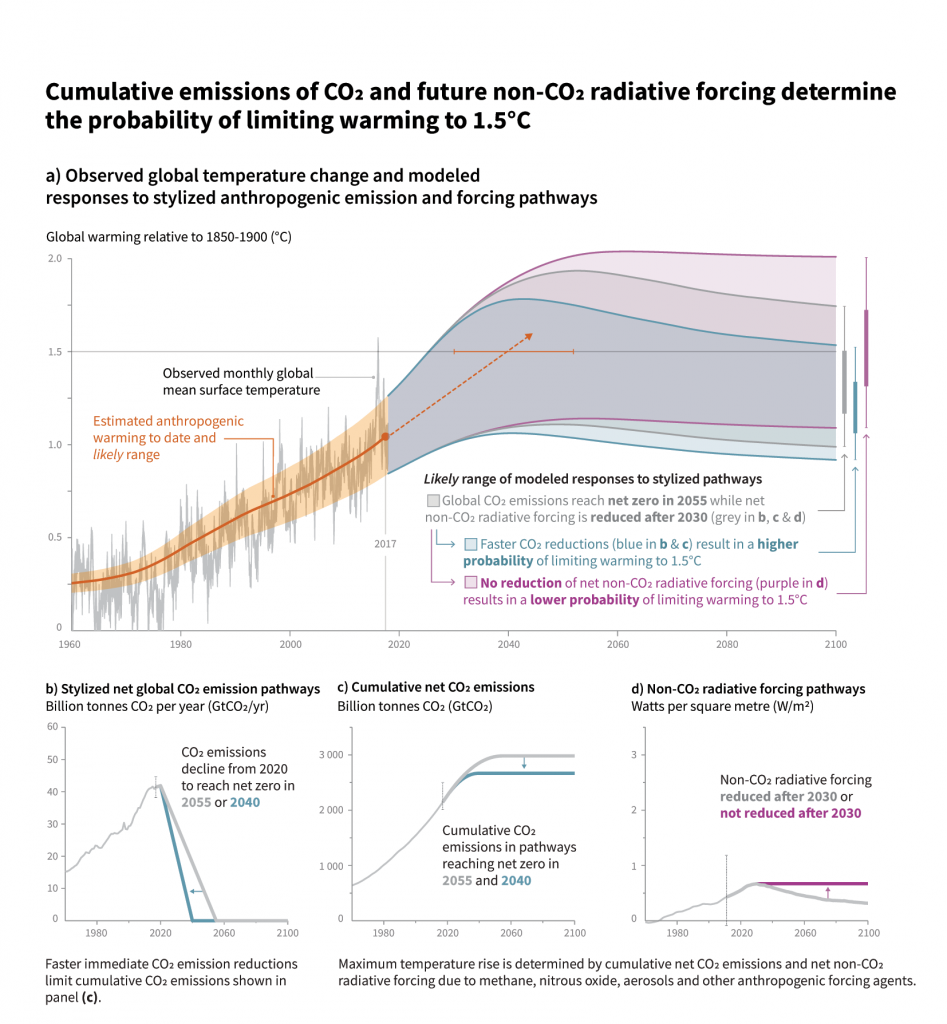
Panel a: Observed monthly global mean surface temperature (GMST, grey line up to 2017, from the HadCRUT4, GISTEMP, Cowtan–Way, and NOAA datasets) change and estimated anthropogenic global warming (solid orange line up to 2017, with orange shading indicating assessed likely range). Orange dashed arrow and horizontal orange error bar show respectively the central estimate and likely range of the time at which 1.5°C is reached if the current rate of warming continues. The grey plume on the right of panel a shows the likely range of warming responses, computed with a simple climate model, to a stylized pathway (hypothetical future) in which net CO2 emissions (grey line in panels b and c) decline in a straight line from 2020 to reach net zero in 2055 and net non-CO2 radiative forcing (grey line in panel d) increases to 2030 and then declines. The blue plume in panel a) shows the response to faster CO2 emissions reductions (blue line in panel b), reaching net zero in 2040, reducing cumulative CO2 emissions (panel c). The purple plume shows the response to net CO2 emissions declining to zero in 2055, with net non-CO2 forcing remaining constant after 2030. The vertical error bars on right of panel a) show the likely ranges (thin lines) and central terciles (33rd – 66th percentiles, thick lines) of the estimated distribution of warming in 2100 under these three stylized pathways. Vertical dotted error bars in panels b, c and d show the likely range of historical annual and cumulative global net CO2 emissions in 2017 (data from the Global Carbon Project) and of net non-CO2 radiative forcing in 2011 from AR5, respectively. Vertical axes in panels c and d are scaled to represent approximately equal effects on GMST. {1.2.1, 1.2.3, 1.2.4, 2.3, Figure 1.2 and Chapter 1 Supplementary Material, Cross-Chapter Box 2 in Chapter 1}
B.1. Climate models project robust
differences in regional climate characteristics between present-day and global warming of 1.5°C
,and between 1.5°C and 2°C
. These differences include increases in: mean temperature in most land and ocean regions (high confidence), hot extremes in most inhabited regions (high confidence), heavy precipitation in several regions (medium confidence), and the probability of drought and precipitation deficits in some regions (medium confidence). {3.3}
B.1.1. Evidence from attributed changes in some climate and weather extremes for a global warming of about 0.5°C supports the assessment that an additional 0.5°C of warming compared to present is associated with further detectable changes in these extremes (medium confidence). Several regional changes in climate are assessed to occur with global warming up to 1.5°C compared to pre-industrial levels, including warming of extreme temperatures in many regions (high confidence), increases in frequency, intensity, and/or amount of heavy precipitation in several regions (high confidence), and an increase in intensity or frequency of droughts in some regions (medium confidence). {3.2, 3.3.1, 3.3.2, 3.3.3, 3.3.4, Table 3.2}
B.1.2. Temperature extremes on land are projected to warm more than GMST (high confidence): extreme hot days in mid-latitudes warm by up to about 3°C at global warming of 1.5°C and about 4°C at 2°C, and extreme cold nights in high latitudes warm by up to about 4.5°C at 1.5°C and about 6°C at 2°C (high confidence). The number of hot days is projected to increase in most land regions, with highest increases in the tropics (high confidence). {3.3.1, 3.3.2, Cross-Chapter Box 8 in Chapter 3}
B.1.3. Risks from droughts and precipitation deficits are projected to be higher at 2°C compared to 1.5°C of global warming in some regions (medium confidence). Risks from heavy precipitation events are projected to be higher at 2°C compared to 1.5°C of global warming in several northern hemisphere high-latitude and/or high-elevation regions, eastern Asia and eastern North America (medium confidence). Heavy precipitation associated with tropical cyclones is projected to be higher at 2°C compared to 1.5°C global warming (medium confidence). There is generally low confidence in projected changes in heavy precipitation at 2°C compared to 1.5°C in other regions. Heavy precipitation when aggregated at global scale is projected to be higher at 2°C than at 1.5°C of global warming (medium confidence). As a consequence of heavy precipitation, the fraction of the global land area affected by flood hazards is projected to be larger at 2°C compared to 1.5°C of global warming (medium confidence). {3.3.1, 3.3.3, 3.3.4, 3.3.5, 3.3.6}
B.2. By 2100, global mean sea level rise is projected to be around 0.1 metre lower with global warming of 1.5°C compared to 2°C (medium confidence). Sea level will continue to rise well beyond 2100 (high confidence), and the magnitude and rate of this rise depend on future emission pathways. A slower rate of sea level rise enables greater opportunities for adaptation in the human and ecological systems of small islands, low-lying coastal areas and deltas (medium confidence). {3.3, 3.4, 3.6}
B.2.1. Model-based projections of global mean sea level rise (relative to 1986–2005) suggest an indicative range of 0.26 to 0.77 m by 2100 for 1.5°C of global warming, 0.1 m (0.04–0.16 m) less than for a global warming of 2°C (medium confidence). A reduction of 0.1 m in global sea level rise implies that up to 10 million fewer people would be exposed to related risks, based on population in the year 2010 and assuming no adaptation (medium confidence). {3.4.4, 3.4.5, 4.3.2}
B.2.2. Sea level rise will continue beyond 2100 even if global warming is limited to 1.5°C in the 21st century (high confidence). Marine ice sheet instability in Antarctica and/or irreversible loss of the Greenland ice sheet could result in multi-metre rise in sea level over hundreds to thousands of years. These instabilities could be triggered at around 1.5°C to 2°C of global warming (medium confidence). (Figure SPM.2) {3.3.9, 3.4.5, 3.5.2, 3.6.3, Box 3.3}
B.2.3. Increasing warming amplifies the exposure of small islands, low-lying coastal areas and deltas to the risks associated with sea level rise for many human and ecological systems, including increased saltwater intrusion, flooding and damage to infrastructure (high confidence). Risks associated with sea level rise are higher at 2°C compared to 1.5°C. The slower rate of sea level rise at global warming of 1.5°C reduces these risks, enabling greater opportunities for adaptation including managing and restoring natural coastal ecosystems and infrastructure reinforcement (medium confidence). (Figure SPM.2) {3.4.5, Box 3.5}
B.3. On land, impacts on biodiversity and ecosystems, including species loss and extinction, are projected to be lower at 1.5°C of global warming compared to 2°C. Limiting global warming to 1.5°C compared to 2°C is projected to lower the impacts on terrestrial, freshwater and coastal ecosystems and to retain more of their services to humans (high confidence). (Figure SPM.2) {3.4, 3.5, Box 3.4, Box 4.2, Cross-Chapter Box 8 in Chapter 3}
B.3.1. Of 105,000 species studied
, 6% of insects, 8% of plants and 4% of vertebrates are projected to lose over half of their climatically determined geographic range for global warming of 1.5°C, compared with 18% of insects, 16% of plants and 8% of vertebrates for global warming of 2°C (medium confidence). Impacts associated with other biodiversity-related risks such as forest fires and the spread of invasive species are lower at 1.5°C compared to 2°C of global warming (high confidence). {3.4.3, 3.5.2}
B.3.2. Approximately 4% (interquartile range 2–7%) of the global terrestrial land area is projected to undergo a transformation of ecosystems from one type to another at 1°C of global warming, compared with 13% (interquartile range 8–20%) at 2°C (medium confidence). This indicates that the area at risk is projected to be approximately 50% lower at 1.5°C compared to 2°C (medium confidence). {3.4.3.1, 3.4.3.5}
B.3.3. High-latitude tundra and boreal forests are particularly at risk of climate change-induced degradation and loss, with woody shrubs already encroaching into the tundra (high confidence) and this will proceed with further warming. Limiting global warming to 1.5°C rather than 2°C is projected to prevent the thawing over centuries of a permafrost area in the range of 1.5 to 2.5 million km2 (medium confidence). {3.3.2, 3.4.3, 3.5.5}
B.4. Limiting global warming to 1.5°C compared to 2ºC is projected to reduce increases in ocean temperature as well as associated increases in ocean acidity and decreases in ocean oxygen levels (high confidence). Consequently, limiting global warming to 1.5°C is projected to reduce risks to marine biodiversity, fisheries, and ecosystems, and their functions and services to humans, as illustrated by recent changes to Arctic sea ice and warm-water coral reef ecosystems (high confidence). {3.3, 3.4, 3.5, Box 3.4, Box 3.5}
B.4.1. There is high confidence that the probability of a sea ice-free Arctic Ocean during summer is substantially lower at global warming of 1.5°C when compared to 2°C. With 1.5°C of global warming, one sea ice-free Arctic summer is projected per century. This likelihood is increased to at least one per decade with 2°C global warming. Effects of a temperature overshoot are reversible for Arctic sea ice cover on decadal time scales (high confidence). {3.3.8, 3.4.4.7}
B.4.2. Global warming of 1.5°C is projected to shift the ranges of many marine species to higher latitudes as well as increase the amount of damage to many ecosystems. It is also expected to drive the loss of coastal resources and reduce the productivity of fisheries and aquaculture (especially at low latitudes). The risks of climate-induced impacts are projected to be higher at 2°C than those at global warming of 1.5°C (high confidence). Coral reefs, for example, are projected to decline by a further 70–90% at 1.5°C (high confidence) with larger losses (>99%) at 2ºC (very high confidence). The risk of irreversible loss of many marine and coastal ecosystems increases with global warming, especially at 2°C or more (high confidence). {3.4.4, Box 3.4}
B.4.3. The level of ocean acidification due to increasing CO2 concentrations associated with global warming of 1.5°C is projected to amplify the adverse effects of warming, and even further at 2°C, impacting the growth, development, calcification, survival, and thus abundance of a broad range of species, for example, from algae to fish (high confidence). {3.3.10, 3.4.4}
B.4.4. Impacts of climate change in the ocean are increasing risks to fisheries and aquaculture via impacts on the physiology, survivorship, habitat, reproduction, disease incidence, and risk of invasive species (medium confidence) but are projected to be less at 1.5ºC of global warming than at 2ºC. One global fishery model, for example, projected a decrease in global annual catch for marine fisheries of about 1.5 million tonnes for 1.5°C of global warming compared to a loss of more than 3 million tonnes for 2°C of global warming (medium confidence). {3.4.4, Box 3.4}
B.5. Climate-related risks to health, livelihoods, food security, water supply, human security, and economic growth are projected to increase with global warming of 1.5°C and increase further with 2°C. (Figure SPM.2) {3.4, 3.5, 5.2, Box 3.2, Box 3.3, Box 3.5, Box 3.6, Cross-Chapter Box 6 in Chapter 3, Cross-Chapter Box 9 in Chapter 4, Cross-Chapter Box 12 in Chapter 5, 5.2}
B.5.1. Populations at disproportionately higher risk of adverse consequences with global warming of 1.5°C and beyond include disadvantaged and vulnerable populations, some indigenous peoples, and local communities dependent on agricultural or coastal livelihoods (high confidence). Regions at disproportionately higher risk include Arctic ecosystems, dryland regions, small island developing states, and Least Developed Countries (high confidence). Poverty and disadvantage are expected to increase in some populations as global warming increases; limiting global warming to 1.5°C, compared with 2°C, could reduce the number of people both exposed to climate-related risks and susceptible to poverty by up to several hundred million by 2050 (medium confidence). {3.4.10, 3.4.11, Box 3.5, Cross-Chapter Box 6 in Chapter 3, Cross-Chapter Box 9 in Chapter 4, Cross-Chapter Box 12 in Chapter 5, 4.2.2.2, 5.2.1, 5.2.2, 5.2.3, 5.6.3}
B.5.2. Any increase in global warming is projected to affect human health, with primarily negative consequences (high confidence). Lower risks are projected at 1.5°C than at 2°C for heat-related morbidity and mortality (very high confidence) and for ozone-related mortality if emissions needed for ozone formation remain high (high confidence). Urban heat islands often amplify the impacts of heatwaves in cities (high confidence). Risks from some vector-borne diseases, such as malaria and dengue fever, are projected to increase with warming from 1.5°C to 2°C, including potential shifts in their geographic range (high confidence). {3.4.7, 3.4.8, 3.5.5.8}
B.5.3. Limiting warming to 1.5°C compared with 2°C is projected to result in smaller net reductions in yields of maize, rice, wheat, and potentially other cereal crops, particularly in sub-Saharan Africa, Southeast Asia, and Central and South America, and in the CO2-dependent nutritional quality of rice and wheat (high confidence). Reductions in projected food availability are larger at 2°C than at 1.5°C of global warming in the Sahel, southern Africa, the Mediterranean, central Europe, and the Amazon (medium confidence). Livestock are projected to be adversely affected with rising temperatures, depending on the extent of changes in feed quality, spread of diseases, and water resource availability (high confidence). {3.4.6, 3.5.4, 3.5.5, Box 3.1, Cross-Chapter Box 6 in Chapter 3, Cross-Chapter Box 9 in Chapter 4}
B.5.4. Depending on future socio-economic conditions, limiting global warming to 1.5°C compared to 2°C may reduce the proportion of the world population exposed to a climate change-induced increase in water stress by up to 50%, although there is considerable variability between regions (medium confidence). Many small island developing states could experience lower water stress as a result of projected changes in aridity when global warming is limited to 1.5°C, as compared to 2°C (medium confidence). {3.3.5, 3.4.2, 3.4.8, 3.5.5, Box 3.2, Box 3.5, Cross-Chapter Box 9 in Chapter 4}
B.5.5. Risks to global aggregated economic growth due to climate change impacts are projected to be lower at 1.5°C than at 2°C by the end of this century
(medium confidence). This excludes the costs of mitigation, adaptation investments and the benefits of adaptation. Countries in the tropics and Southern Hemisphere subtropics are projected to experience the largest impacts on economic growth due to climate change should global warming increase from 1.5°C to 2°C (medium confidence). {3.5.2, 3.5.3}
B.5.6. Exposure to multiple and compound climate-related risks increases between 1.5°C and 2°C of global warming, with greater proportions of people both so exposed and susceptible to poverty in Africa and Asia (high confidence). For global warming from 1.5°C to 2°C, risks across energy, food, and water sectors could overlap spatially and temporally, creating new and exacerbating current hazards, exposures, and vulnerabilities that could affect increasing numbers of people and regions (medium confidence). {Box 3.5, 3.3.1, 3.4.5.3, 3.4.5.6, 3.4.11, 3.5.4.9}
B.5.7. There are multiple lines of evidence that since AR5 the assessed levels of risk increased for four of the five Reasons for Concern (RFCs) for global warming to 2°C (high confidence). The risk transitions by degrees of global warming are now: from high to very high risk between 1.5°C and 2°C for RFC1 (Unique and threatened systems) (high confidence); from moderate to high risk between 1°C and 1.5°C for RFC2 (Extreme weather events) (medium confidence); from moderate to high risk between 1.5°C and 2°C for RFC3 (Distribution of impacts) (high confidence); from moderate to high risk between 1.5°C and 2.5°C for RFC4 (Global aggregate impacts) (medium confidence); and from moderate to high risk between 1°C and 2.5°C for RFC5 (Large-scale singular events) (medium confidence). (Figure SPM.2) {3.4.13; 3.5, 3.5.2}
B.6. Most adaptation needs will be lower for global warming of 1.5°C compared to 2°C (high confidence). There are a wide range of adaptation options that can reduce the risks of climate change (high confidence). There are limits to adaptation and adaptive capacity for some human and natural systems at global warming of 1.5°C, with associated losses (medium confidence). The number and availability of adaptation options vary by sector (medium confidence). {Table 3.5, 4.3, 4.5, Cross-Chapter Box 9 in Chapter 4, Cross-Chapter Box 12 in Chapter 5}
B.6.1. A wide range of adaptation options are available to reduce the risks to natural and managed ecosystems (e.g., ecosystem-based adaptation, ecosystem restoration and avoided degradation and deforestation, biodiversity management, sustainable aquaculture, and local knowledge and indigenous knowledge), the risks of sea level rise (e.g., coastal defence and hardening), and the risks to health, livelihoods, food, water, and economic growth, especially in rural landscapes (e.g., efficient irrigation, social safety nets, disaster risk management, risk spreading and sharing, and community-based adaptation) and urban areas (e.g., green infrastructure, sustainable land use and planning, and sustainable water management) (medium confidence). {4.3.1, 4.3.2, 4.3.3, 4.3.5, 4.5.3, 4.5.4, 5.3.2, Box 4.2, Box 4.3, Box 4.6, Cross-Chapter Box 9 in Chapter 4}.
B.6.2. Adaptation is expected to be more challenging for ecosystems, food and health systems at 2°C of global warming than for 1.5°C (medium confidence). Some vulnerable regions, including small islands and Least Developed Countries, are projected to experience high multiple interrelated climate risks even at global warming of 1.5°C (high confidence). {3.3.1, 3.4.5, Box 3.5, Table 3.5, Cross-Chapter Box 9 in Chapter 4, 5.6, Cross-Chapter Box 12 in Chapter 5, Box 5.3}
B.6.3. Limits to adaptive capacity exist at 1.5°C of global warming, become more pronounced at higher levels of warming and vary by sector, with site-specific implications for vulnerable regions, ecosystems and human health (medium confidence). {Cross-Chapter Box 12 in Chapter 5, Box 3.5, Table 3.5}
https://www.ipcc.ch/sr15/chapter/spm/
melkior- Posts : 17503
2015-08-09
Re: Trump prošao pokraj buduće nobelovke za mir kao pokraj turskog groblja
by prckov Tue 24 Sep - 22:23
kome lijepis te fake grafikone
citaj tulo nezavisne znanstvenike,
gledaj drugu stranu price a ne medisko smece I interesne drzavne nazovi znanstvenike
jos fali da mi cnn ubacis sa svojom statistikom
znas li da ne dozvoljavaju uopce znanstvenike sa suprotnim stajalistima I informacijama u medije, jel to znanost I nacin da se ustanovi istina
misli tim supkom sta si se zafuro ko corava kokos
_________________
It was always the women, and above all the young ones, who were the most bigotet adherents of the party, the swallowers of slogans, the amateur spies and nosers-out of unortodoxy.
Orwell 1984
prckov- Posts : 34555
2014-04-18
Re: Trump prošao pokraj buduće nobelovke za mir kao pokraj turskog groblja
by melkior Tue 24 Sep - 22:38
prckov wrote:alo
kome lijepis te fake grafikone
citaj tulo nezavisne znanstvenike,
gledaj drugu stranu price a ne medisko smece I interesne drzavne nazovi znanstvenike
jos fali da mi cnn ubacis sa svojom statistikom
znas li da ne dozvoljavaju uopce znanstvenike sa suprotnim stajalistima I informacijama u medije, jel to znanost I nacin da se ustanovi istina
misli tim supkom sta si se zafuro ko corava kokos
From sea to rising sea: Climate change in America
Climate change will affect every American in the coming decades — the question is, to what degree?
By Leah Burrows
Professor Michael McElroy discusses a world without fossil fuels, the economics of changing energy systems and the future of energy and climate in the U.S.
So, the climate is getting warmer. Who cares?
Climate change has a PR problem in America.
For decades, we called it ‘global warming,’ an innocuous-sounding phrase invoking a gentle increase in worldwide temperatures, like turning up the thermostat in a house.
“People asked, so the climate is getting warmer. Who cares?” said Michael B. McElroy, the Gilbert Butler Professor of Environmental Studies at Harvard University. “And scientists are partly to blame for that because of how we’ve described climate change.”
It’s been difficult to get Americans worried about a 1-degree increase in temperature over a 100-year period, especially when most of the images associated with global warming — crumbling ice sheets or a lonely polar bear padding across a melted landscape — feel so distant.
But climate change is here. Mitigating the effects of global warming — better described as irreversible changes to the climate structure — is about more than saving the planet in the longer term; it’s about saving human lives in the near term.
From severe storms and catastrophic flooding to record-breaking droughts and deadly wildfires, Americans are living with the consequences of a changing climate every day. Still, the majority of Americans did not believe climate change would harm them personally, according to a Yale University study. That connection — between climate change and human health — has been, in large part, missing from public conversations and political debate in America today.
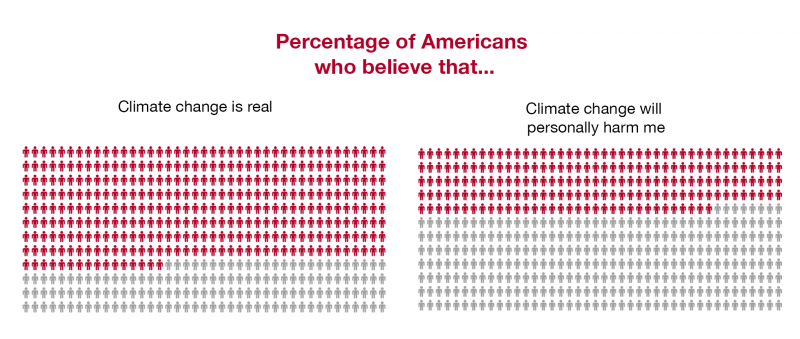
Howe, Peter D., Matto Mildenberger, Jennifer R. Marlon, and Anthony Leiserowitz (2015). “Geographic variation in opinions on climate change at state and local scales in the USA.” Nature Climate Change, doi:10.1038/nclimate2583
Researchers at the Harvard John A. Paulson School of Engineering and Applied Sciences (SEAS) are exploring that connection between human health and a changing climate. Among their findings: In Pennsylvania, days with dangerously high surface ozone levels could increase by 100 percent in the coming decades, increasing the risk of asthma and other respiratory diseases in children. Wildfires in Washington could choke densely populated areas for days with thick, harmful smoke. Severe storms in Texas, Oklahoma, Nebraska, Iowa, the Dakotas and adjoining states could deplete protective ozone in the stratosphere, exposing humans, livestock and crops to harmful ultraviolet radiation.

The Eastern U.S.: The heat is rising
If the world were to cut all of its carbon emissions tomorrow, temperatures have already risen enough to cause more severe and prolonged heat waves. Extreme heat has serious impact on human health. Depending on humidity levels, prolonged exposure to 100-plus degree days can lead to heat stroke and dehydration, as well as cardiovascular, respiratory, and cerebrovascular diseases.In the past decade, extreme heat waves in the U.S. have killed hundreds of people, mostly elderly and poor in urban areas, and cost tens of billions in damage. Northern cities, such as Chicago, New York, Philadelphia and Boston, which are less prepared to deal with excessive temperatures, will likely face the brunt of the public health burden of heat waves in coming years.
With little ability to stop future heat waves, the best option to mitigate damage is preparation. Improving our ability to accurately predict heat waves can save lives.
Most current models cannot forecast beyond about 10 days and seasonal models have limited ability to predict extreme events. In 2012, for example, the National Weather Service’s Climate Prediction Center forecasted normal summer temperatures in the Northeast and Midwest U.S. Instead, the regions experienced three separate, record-breaking heat events in June and July that resulted in more than 100 deaths.
Peter Huybers, Professor of Earth and Planetary Sciences in the Department of Earth and Planetary Sciences and of Environmental Science and Engineering at SEAS, is working to understand and predict these deadly temperature spikes. Huybers and his lab identified sea surface temperature patterns that can predict increased odds of extreme heat waves in the eastern U.S. up to 50 days in advance. Those patterns — like a fingerprint on the surface of the Pacific Ocean — consistently precede heat waves in the eastern U.S.
 Peter Huybers, professor of earth and planetary sciences and of environmental science and engineering (Photo courtesy of Eliza Grinnell)
The Huybers team found that lack of precipitation, which is known to contribute to heat waves, is also associated with this finger print — known as the Pacific Extreme Pattern. While it does not guarantee that a heat wave will strike, seeing this pattern significantly increases the odds of one happening.
“Our technique was able to predict previous heat waves, including the deadly heat waves of 2012, and was skillful when applied to earlier events between 1950 and 1980,” said Huybers. “However, the technique doesn’t predict the Dust Bowl years of the 1930s, reminding us that other environmental factors must also be important.”
Huybers and his colleagues are continuing to research this connection, pushing the horizon on predicting summer heat waves in the eastern U.S.
With more time to prepare, utility companies could ensure they have enough power options to deal with a spike in demand; farmers could alter irrigation tactics to prevent crop loss; city planners could set up cooling spaces for the elderly or those without air conditioners and step up programs to track homeless people and homebound, chronically ill older Americans.
As the air warms due to global climate change, Northeastern urban and suburban areas could also see an increase in ground level ozone — the nasty chemical compound that makes up the majority of smog, especially in summer.
Ground level ozone is created by chemical reactions involving oxides of nitrogen (NOx), volatile organic compounds (VOCs) and sunlight. Factories, power plants and cars produce most of the NOx in the U.S.
Ozone is well known to cause serious respiratory illness and is especially dangerous for children, seniors, and people suffering from asthma.
“Even short-term exposure to ozone over a few hours or days has been linked to serious health effects,” said Loretta J. Mickley, Senior Research Fellow in Chemistry-Climate Interactions in the Atmospheric Chemistry Modeling Group. “High levels of ozone can exacerbate chronic lung disease and increase death rates.”
The power of regulation
It’s easy to feel helpless and overwhelmed in the face of global climate change but legislative action can make a difference when it comes to the environment. Elsie Sunderland, the Thomas D. Cabot Associate Professor of Environmental Science and Engineering, found that regulations requiring the reduction of mercury emissions had a larger impact on the environment than researchers previously thought. Between 1990 and 2010, global mercury emissions from manmade sources declined 30 percent. The reduction in atmospheric mercury was most pronounced over North America, where mercury had been gradually phased out of many commercial products and controls were put in place on coal-fired power plants that removed naturally occurring mercury from the coal being burned.Researchers have long known that temperature and ozone are linked — the hotter the temperature, the higher the ozone levels. However, researchers have also established that if the temperatures rise above the mid-90s Fahrenheit, this relationship can break down. So, the question is: how will rising global temperatures impact the severity and frequency of days with dangerously high levels of ground ozone, known as ozone episodes?
Mickley and her team are unraveling the complex relationship between ozone and rising temperatures in the U.S.
In 2016, graduate student Lu Shen and Mickley found that if local and global emissions continue unchecked and temperatures rise as projected, the U.S. could see a 70- to 100-percent increase in dangerous ozone episodes, depending on the region.
The Northeast, California and parts of the Southwest, would be most affected, experiencing up to nine additional days per year of unhealthy ozone levels in the next 50 years. The rest of the country could experience up to three additional days of unhealthy ozone.
What does that mean for health in the U.S.? Hospital admissions and emergency department visits would increase, cases of chronic respiratory conditions, such as asthma and chronic bronchitis, would increase, and more people could die from respiratory illness.
“We need ambitious emissions controls to offset the potential of more than a week of additional days with unhealthy ozone levels,” said Mickley.
The good news is, we’ve already seen the powerful effect regulation has on ozone levels in the U.S. Between 1990 and 2016, ozone levels decreased significantly, especially on the east coast, thanks to the Clean Air Act and its amendments, which targeted ozone precursors.
The bad news is that high temperatures can upend that trend.
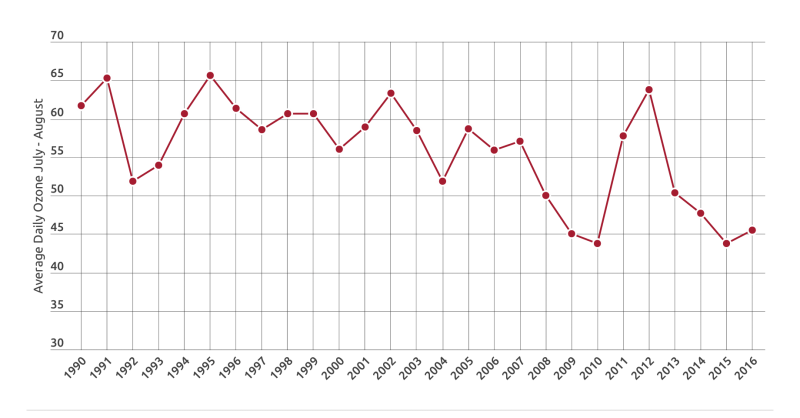
The graph shows 15 years of surface ozone measurements in Madison County, Illinois. Since 1990, ozone decreased over time due to the powerful Clean Air Act and its amendments, which reduced emissions of ozone precursors. But very hot temperatures — as seen in 2012 — buck that trend. A similar pattern was seen at measuring sites across the country. A full, interactive map is available here.
Mickley and her team are also developing tools to predict when and where Americans are most at risk for increased levels of ozone in the short-term.
The researchers found that high levels of summertime ozone in the Eastern U.S. are correlated with large-scale meteorological patterns in the spring, including sea surface temperatures. The team used this relationship to predict average summertime ozone levels one season in advance.
“A prediction tool could act as an early warning system to communities most at risk for high-ozone days,” said Mickley. “Local communities could mobilize resources and plan protocols to help its most at-risk citizens, including children and seniors, during episodes in the upcoming ozone season. Such protocols could include advisories for people to stay indoors.”

Brewing storms in the Midwest
As temperatures increase and more water vapor evaporates into the atmosphere, storms will become more frequent and more intense — especially in the Midwest.Flooding and damage associated with these storms is a threat to the lives and livelihood of the 60 million people living in the Midwestern states, especially farmers who rely on predictable rainfall patterns. But the intensity of these storms, combined with factors unique to the Great Plains region, may also damage the protective ozone layer that shields life on Earth from harmful ultraviolet radiation.
James G. Anderson, the Philip S. Weld Professor of Atmospheric Chemistry at SEAS and the Department of Earth and Planetary Sciences, is studying this phenomena. In 2012, his team discovered that during intense summer storms over the Midwest, water vapor from these storms is injected deep into the stratosphere. By studying ozone loss over the Arctic in winter, Anderson and his collaborators established that combinations of both temperature and water vapor convert stable forms of chlorine and bromine into free radicals capable of transforming ozone molecules into oxygen, implicating storm-injected water vapor in the loss of ozone over the U.S. in summer.
By using advanced radar techniques, Anderson and his team, including researchers at Texas A&M and the University of Oklahoma, recently found that thousands of storms each summer penetrate the stratosphere to provide fuel for these reactions — far more than previously thought.
“Rather than large, continental scale ozone loss that occurs over the polar regions in winter, these radar observations and our new high accuracy, high spatial resolution temperature measurements found that the structure of ozone loss in the central U.S. is highly localized over numerous regions,” said Anderson.
These reactions, depending on the temperature of the stratosphere, could trigger a 12- to 17-percent decrease in ozone in the lower stratosphere one week after a storm. This corresponds to a 2- to 3-percent decrease in stratospheric ozone in the region of enhanced water vapor. Even a 1-percent decrease in stratospheric ozone can lead to a 3-percent increase in skin cancer in humans – there are three and a half million new cases of skin cancer diagnosed each year in the U.S. alone. Since ultraviolet radiation also impairs the molecular chemistry of photosynthesis, such a change could also have a major effect on agriculture in the Midwest.
“This isn’t about just human health, this is about crop yields, livestock, and the ability to function for extended periods outside in the summer,” said Anderson.
Anderson and his lab are developing new platforms to observe this phenomena in action. Central to that effort is a research platform called the StratoCruiser, a super-pressure balloon designed to collect data at an average of 75,000 feet — well into the stratosphere.
Powered by an array of solar cells, the StratoCruiser will fly above the central U.S. for four to six weeks, collecting data on how water vapor injected into the stratosphere alters the properties of particles and initiates the series of chemical reactions that destroy ozone.
Anderson and his team are developing sensing instruments sturdy enough to withstand winds and rain from intense convective storms yet lightweight enough to allow the instrument package, suspended on a Kevlar filament below the balloon, to sample air between 40,000ft and 75,000ft.
The instruments have to work at temperatures ranging from minus 120 degrees to plus 90 degrees Fahrenheit, withstand the low pressure of the upper atmosphere, power themselves and operate autonomously for the six-week mission.
SEAS undergraduates in Anderson’s Engineering Problem Solving and Design Project (ES 96) are playing an important role in solving these design challenges. The student team who designed a spectrometer that measures hydrochloric acid (HCl) in the atmosphere was awarded $200,000 from NASA’s Undergraduate Student Instrument Project grant. The new instrument will be launched by NASA fall 2017 from Ft. Sumner, New Mexico.
Another ES 96 project for undergraduates involves designing and building a new class of instruments to measure free radicals and other reactive species from solar powered stratospheric aircraft. These instruments, which will collect data over the U.S. continuously for three months, will provide the ability to forecast the amount of UV radiation projected for specific regions of the Great Plains states in summer. The solar powered stratospheric aircraft can also circumnavigate the globe to obtain observations related to the response of the climate structure to increasing levels of carbon dioxide and methane.
One of the biggest questions Anderson and others want to answer is whether or not the process of ozone depletion is reversible.
Anderson knows how well-communicated science can spur action on climate change. It was his research in the late 1980s that finally proved the link between chlorofluorocarbons (CFCs) from aerosol cans, air conditioners and refrigerators and the Antarctic ozone hole. The discovery was the key step towards public acceptance of the connection, which ultimately led to the phase-out of CFCs under 197-country Montreal Protocol signed in 1987.
“We saw the power of regulation and legislation when global powers got together and decided to ban CFCs,” said Anderson. “After that, we thought we’d solved the problem of ozone depletion. Now, it could be made much worse than we thought by climate change. If we continue on this course, decreases in ozone and associated increases in UV dosage could be irreversible.”
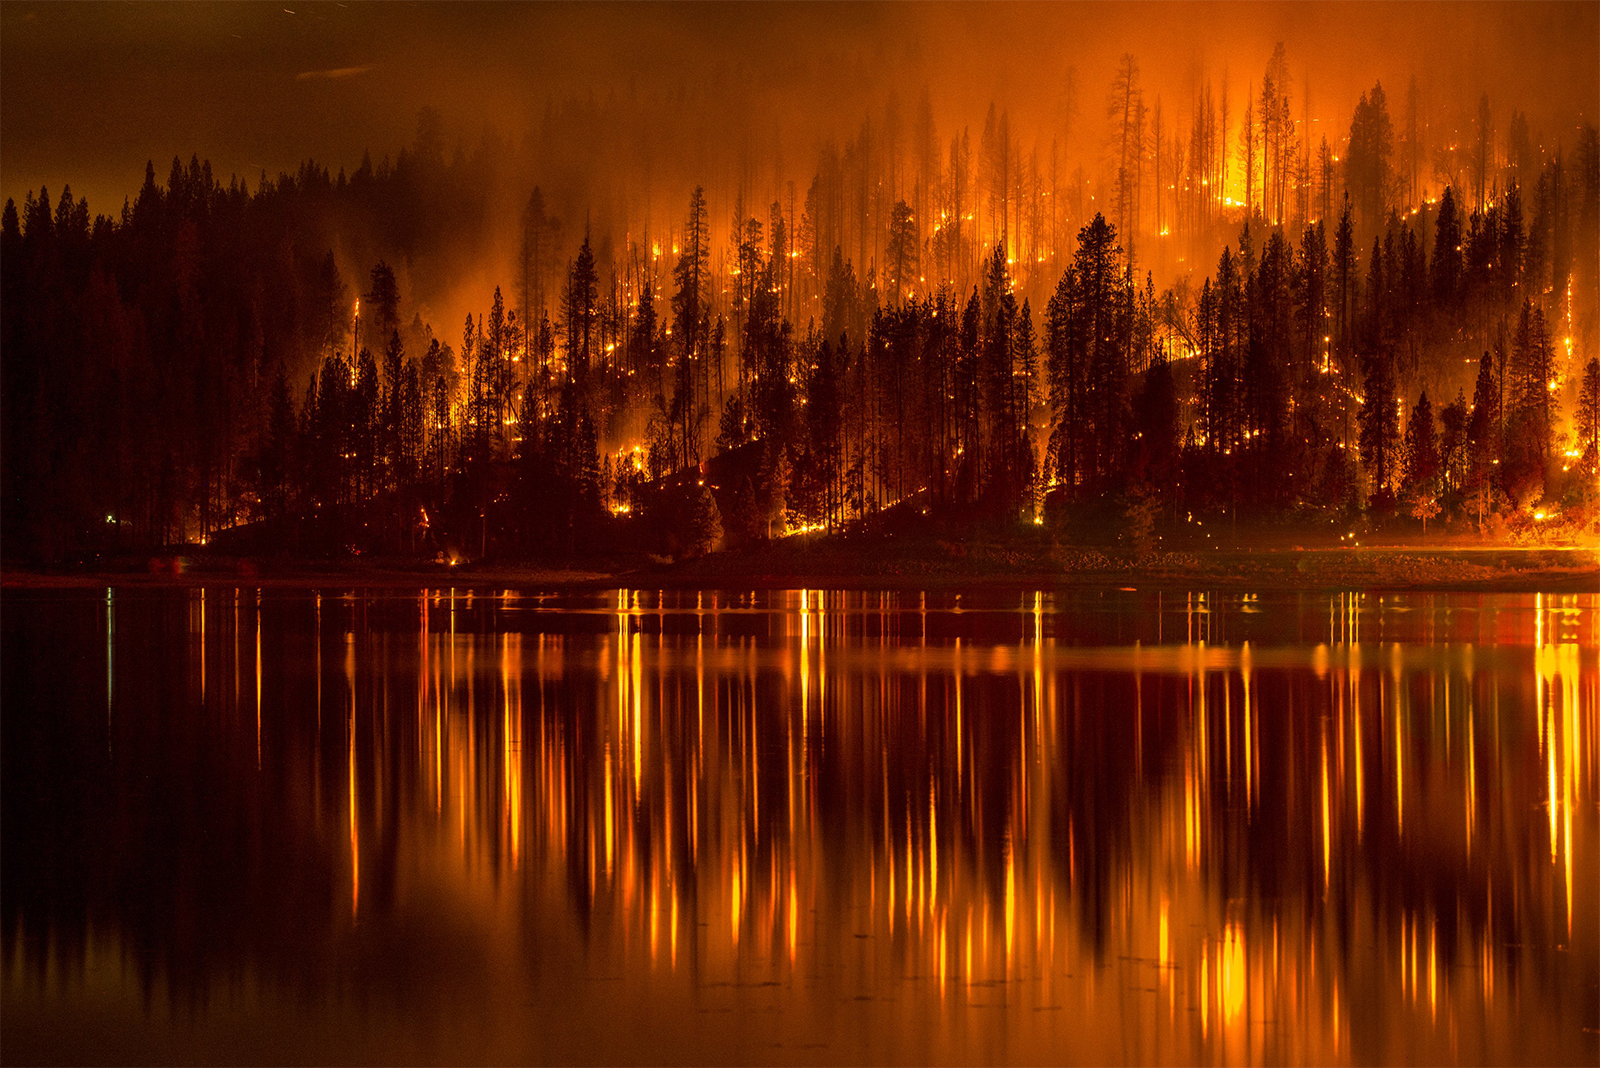
The West is burning
In 2016 alone, more than 67,000 wildfires burned over 5.5 million acres in the U.S., an area equivalent to the size of New Jersey. If global warming continues on pace, the models predict that by 2050 the wildfire season in the western U.S. will be about three weeks longer, twice as smoky, and will burn more area. In the coming decades, the area burned in August could increase by 65 percent in the Pacific Northwest; could nearly double in the Eastern Rocky Mountains/Great Plains; and quadruple in the Rocky Mountains Forest region.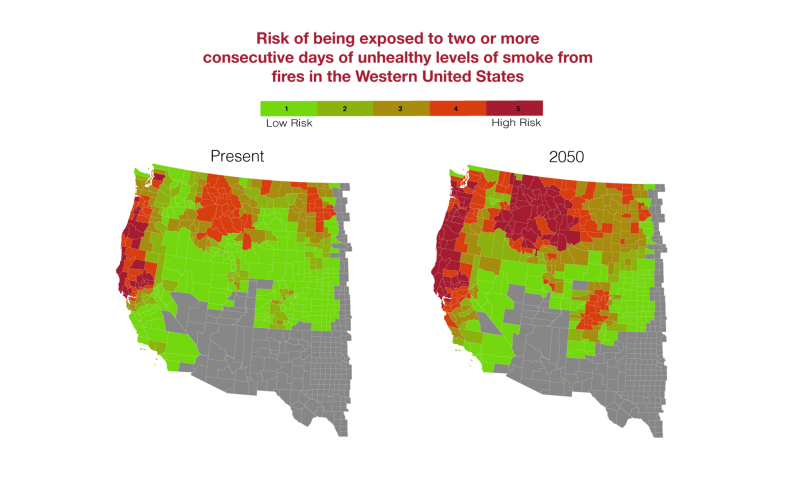
Liu, JC, LJ Mickley, MP Sulprizio, X Yue, K Ebisu, GB Anderson, R Khan, ML Bell, M Bravo, and F. Dominici. 2016. Particulate Air Pollution from Wildfires in the Western US under climate change. Climatic Change. 138 (3): 655-666. View the interactive map here.
But wildfires threaten more than land and homes. The smoke they produce contains particles that can contaminate the air hundreds of miles away. As wildfires increase in frequency and intensity, more and more communities are at risk of prolonged exposure to harmful levels of smoke, including heavily populated areas such as California’s San Francisco, Alameda, and Contra Costa counties, and King County in Washington.
Mickley and the Atmospheric Chemistry Modeling Group are developing tools to predict how wildfires will impact air quality. The work is part of a collaboration with Yale University.
Between 2004 and 2009, about 57 million people in the western U.S. experienced a smoke wave, a term Mickley and her colleagues coined to describe two or more consecutive days of unhealthy levels of smoke from fires. Between 2046 and 2051, the team estimated more than 82 million people are likely to be affected by smoke waves, mostly in Northern California, Western Oregon and the Great Plains, where fire fuel is plentiful.
 Loretta J. Mickley, Senior Research Fellow in Chemistry-Climate Interactions (Photo courtesy of Eliza Grinnell/Harvard SEAS)
All across the western U.S., climate change will likely cause smoke waves to be longer, more intense, and more frequent. About 13 million more children and seniors — who are at higher risk for respiratory illness — will be affected by smoke waves compared with the present day.
Mickley and her team have developed a model to predict, at the county level, areas most at risk for smoke waves. The model would allow local governments or the U.S. Forest Service to prioritize these areas in fire mitigation efforts such as clearing out dry underbrush or performing controlled burns.
“No matter what ignites a wildfire, whether by lightning or human carelessness, the spread of a fire is determined by the availability of dry, easily combustible fuel,” said Mickley. “We’re currently seeing and we will continue to see in future decades, warmer temperatures increase the supply of such fuel. The massive fires of 2016 are likely an indication of what’s to come.”
How we know what we know
For nearly 20 years, the GEOS-Chem global transport model has provided hundreds of research groups around the world insight into the chemical composition of the atmosphere and how it is being impacted by human activity. Developed by Daniel Jacob, the Vasco McCoy Family Professor of Atmospheric Chemistry and Environmental Engineering at SEAS and the Department of Earth and Planetary Sciences, and housed at Harvard University, the open source model is an international standard for modeling pollution. Since its inception, the model has been used to understand the global biogeochemical cycling of mercury; the intercontinental transport of air pollution, which is critical to EPA’s setting of air quality standards; and has added considerably to the knowledge of worldwide emissions of pollutants and climate gases.Pollution knows no borders
It’s not just the continental U.S. that is facing health consequences from global climate change. Alaska, Hawaii and many American territories are on the front lines of climate change.In 2016, a DC-8 loaded with scientific instruments took off from Palmdale, California, ascending through a sky thick with wildfire smoke and smog from nearby Los Angeles.
It was a fitting start to the first leg of the Atmospheric Tomography Mission (ATom), led by Steven C. Wofsy, the Abbott Lawrence Rotch Professor of Atmospheric and Environmental Science at SEAS and the Department of Earth and Planetary Sciences. Since 2016, the ATom mission has made two trips around the world — pole to pole — taking atmospheric measurements to understand how pollution and greenhouse gasses move through the atmosphere.
The ATom mission, in partnership with NASA, will fly a total of four trips around the world. The data it collects will help improve the accuracy of the environmental models that inform climate policies.
That first leg gave the research team a sobering view of the scope of climate change in America and American territories. Several hours after leaving the searing heat and wildfires of California, the team flew over Alaska, where large dark pools of water disrupted what should have been a continuous sheet of white, polar ice.
“The contrast between the environments could not have been more dramatic yet, both places were experiencing huge impacts from the warming climate,” said Wofsy.
And even though no major fires were burning in northern Alaska when the ATom team conducted their first mission, the researchers recorded high levels of pollution from wildfires burning hundreds of miles away, in the forests of Siberia.
“Pollution can be transported anywhere,” said Roisin Commane, research associate in environmental science and engineering at SEAS and member of the ATom team. “We saw pollution thousands of miles from shore, in what should have been some of the cleanest air in the world. We saw pollution from Asia transported over the Pacific Ocean and pollution from the U.S. over the Atlantic. Pollution has no borders.”
Wofsy and Paul Newman of NASA’s Goddard Space Flight Center sent back a video postcard of the first two legs of their Atmospheric Tomography, or ATom mission. The science team first traveled from Palmdale, California, to Anchorage, Alaksa, by way of the North Pole, and on their second leg flew south to Kona, Hawaii. (Credit: NASA’s Goddard Space flight Center/Michael Randazzo)
Engineering hope
These consequences of global warming in the U.S. also know no borders— it affects young and old Americans, East Coast urbanites and Midwestern farmers.In addition to leading efforts to understand the systems that contribute to a warming planet, researchers at SEAS are also developing new tools and technologies to help reverse, or at least slow, the process. That includes projects aimed at generating clean power and storing it in long-lasting batteries.
Eric Mazur, the Balkanski Professor of Physics and Applied Physics, has researched the properties of nanoscale structures in silicon, which have promising applications to improve the capacity of solar cells. Jennifer Lewis, the Hansjörg Wyss Professor of Biologically Inspired Engineering, has helped develop materials for carbon capture and sequestration.
Professors Michael Aziz, the Gene and Tracy Sykes Professor of Materials and Energy Technologies; and Roy Gordon, the Thomas Dudley Cabot Professor of Chemistry and Professor of Materials Science, are developing non-toxic, long-lasting and cost effective flow batteries to store power from intermittent energy sources, like wind and solar.
Flow batteries store energy from renewable sources in liquid tanks filled with non-toxic organic chemicals. (Credit: Harvard SEAS)
SEAS undergraduates are getting involved in the effort as well on Harvard’s campus.
In an ES96 class, SEAS students worked with the university’s Office for Sustainability to evaluate approaches to climate change resilience and develop strategies to enhance the integrity of the electrical grid, cool buildings during extreme heat, and minimize damage from flooding.
“While we may have dysfunction in Washington, parts of the U.S. are doing serious things about climate change,” said McElroy. “California and New England are shining examples. Mayors of major U.S. cities have been leaders in tackling these issues. So, on the optimistic side, there are signs that people can get together and get things done.”
It’s important not to lose that optimism, said Wofsy.
He and the ATom team saw something else on that first flight from California: solar and wind farms generating carbon-free electricity.
“This sight was much more hopeful,” Wofsy said. “If we apply our minds and resources to the problem, we can make significant progress in slowing the increase in atmospheric CO2. But it’s a generational challenge.”
https://www.seas.harvard.edu/content/from-sea-to-rising-sea-climate-change-in-america
melkior- Posts : 17503
2015-08-09
Re: Trump prošao pokraj buduće nobelovke za mir kao pokraj turskog groblja
by melkior Tue 24 Sep - 22:58
Study of Impacts of Global Warming on Climate Change: Rise in Sea Level and Disaster Frequency
By Bharat Raj Singh and Onkar Singh
Submitted: November 15th 2011Reviewed: June 5th 2012Published: September 19th 2012
DOI: 10.5772/50464
chapter and author info
Authors
Bharat Raj Singh*
- School of Management Sciences, Technical Campus, Lucknow, Uttar Pradesh, India
Onkar Singh
1. Introduction
Global warming and climate change refer to an increase in average global temperatures. Natural events and human activities are believed to be main contributors to such increases in average global temperatures. The climate change, caused by rising emissions of carbon dioxide from vehicles, factories and power stations, will not only effects the atmosphere and the sea but also will alter the geology of the Earth. Emissions of carbon dioxide due to our use of fossil energy will change the climate and the temperature is estimated to increase by 2 to 6o Celsius within year 2100, which is a tremendous increase from our current average temperature of 1.7o Celsius as predicted by IPCC. This may cause huge changes to our civilization, both positive and negative, but the total impact on our society is currently very uncertain. Forecasts indicate that major storms could devastate New York City in next decade whereas Gulf countries will get affected badly well before.Global warming primarily caused by increases in “greenhouse” gases such as Carbon Dioxide (CO2), Nitrous oxide (NOX), Sulphur dioxide (SO2), Hydrogen etc.,. A warming planet thus leads to climate changes which can adversely affect weather in different ways. Some of the prominent indicators for a global warming are detailed below:
[list="list-style-type: roman-lower;"]
[*]Temperature over land
[*]Snow cover on Hills
[*]Glaciers on Hills
[*]Ocean Heat content
[*]Sea Ice
[*]Sea level
[*]Sea surface temperature
[*]Temperature Over Ocean
[*]Humidity
[*]Tropospheric Temperature
[/list]
Past decade, according to Scientists in 48 Countries, it was recorded warmest time phase during meeting of National Oceanic and Atmospheric Administration (NOAA), on July 28, 2010. Although since decades, scientists and environmentalists have been warning that the way we are using Earth’s resources is not sustainable. Alternative technologies have been called for repeatedly, seemingly falling upon deaf ears or, cynically, upon those who don’t want to make substantial changes as it challenge their bottom line and reduces their current profits.
Global warming in today’s scenario is threat to the survival of mankind. In 1956, an US based Chief consultant and oil geologist Marion King Hubert, (1956) predicted that if oil is consumed with high rate, US oil production may peak in 1970 and thereafter it will decline. He also described that other countries may attain peak oil day within 20-30 years and many more may suffer with oil crises within 40 years, when oil wells are going to dry. He illustrated the projection with a bell shaped Hubert Curve based on the availability and its consumptions of the fossil fuel. Large fields are discovered first, small ones later. After exploration and initial growth in output, production plateaus and eventually declines to zero.
Crude oil, coal and gas are the main resources for world energy supply. The size of fossil fuel reserves and the dilemma that when non-renewable energy will be diminished, is a fundamental and doubtful question that needs to be answered. A new formula for calculating, when fossil fuel reserves are likely to be depleted, is presented along with an econometrics model to demonstrate the relationship between fossil fuel reserves and some main variables (Shahriar Shafiee et.al. 2009). The new formula is modified from the Klass model and thus assumes a continuous compound rate and computes fossil fuel reserve depletion times for oil, coal and gas of approximately 35, 107 and 37 years, respectively. This means that coal reserves are available up to 2112, and will be the only fossil fuel remaining after 2042.
In India, vehicular pollution is estimated to have increased eight times over the last two decades. This source alone is estimated to contribute about 70 per cent to the total air pollution. With 243.3 million tons of carbon released from the consumption and combustion of fossil fuels in 1999, India is ranked fifth in the world behind the U.S., China, Russia and Japan. India's contribution to world carbon emissions is expected to increase in the coming years due to the rapid pace of urbanization, shift from non-commercial to commercial fuels, increased vehicular usage and continued use of older and more inefficient coal-fired and fuel power-plants (Singh, BR, et al., 2010).
Thus, peak oil year may be the turning point for mankind which may lead to the end of 100 year of easy growth, if self-sufficiently and sustainability of energy is not maintained on priority. This chapter describes the efforts being made to explore non-conventional energy resources such as: solar energy, wind energy, bio-mass and bio-gas, hydrogen, bio-diesel which may help for the sustainable fossil fuel reserves and reduce the tail pipe emission and other pollutants like: CO2, NOX etc.. The special emphasis is also given for the storage of energy such as compressed air stored from solar, wind and or other resources like: climatic energy to maintain energy sustainability of 21st century. This may also leads to environmentally and ecologically better future.
2. Weather watch: Byron's view of the glaciers
In September 1816, Lord Byron set off from Geneva with his friend Hob house, and kept a journal for his half-sister Augusta. Lodged at the Curate's, set out to see the Valley; heard an Avalanche fall, like thunder; saw Glacier – enormous. Storm came on, thunder, lightning, hail; all in perfection, and beautiful (Fig 1).
Figure 1.
Byron described glaciers in Geneva as "neither mist nor water" in September 1816. (Photograph: John Mcconnico/AP)
He said that he was on horseback; Guide wanted to carry his cane; he was going to give it to him, when he recollected that it was a Swordstick, and he thought lightning might be attracted towards him; kept it himself; a good deal encumbered with it, and his cloak, as it was too heavy for a whip, and the horse was stupid, and stood still with every other peal," he records in Byron: Selections from Poetry, Letters & Journals (Nonesuch Press.)
Got in, not very wet; the cloak being staunch, H wet though. H took refuge in a cottage; sent man, umbrella and cloak (from the Curate's when he arrived) after him. He sees a torrent like the tail of a white horse streaming in the wind, such as it might be conceived would be that of the 'pale horse' on which Death is mounted in the Apocalypse. It is neither mist nor water, but something between both; its immense height (nine hundred feet) gives it a wave, a curve, a spreading here, a condensation there, wonderful and indescribable. He looks again the next day: the Sun upon it forming a rainbow of the lower part of all colours, but principally purple and gold; the bow moving as you move; he never saw anything like this.
3. Global warming issues
3.1. Effect of global warming
With increases in the Earth's global mean temperature i.e., global warming, the various effects on climate change pose risks that increases. The IPCC (2001d and 2007d) has organized many of these risks into five "reasons for concern:- Threats to endangered species and unique systems,
- Damages from extreme climate events,
- Effects that fall most heavily on developing countries and
- The poor within countries, global aggregate impacts (i.e., various measurements of total social, economic and ecological impacts), and large-scale high-impact events.
The effects, or impacts, of climate change may be physical, ecological, social or economic. Evidence of observed climate change includes the instrumental temperature record, rising sea levels, and decreased snow cover in the Northern Hemisphere. According to the Intergovernmental Panel on Climate Change (IPCC, 2007a:10), "[most] of the observed increase in global average temperatures since the mid-20th century is very likely due to the observed increase in [human greenhouse gas] concentrations". It is predicted that future climate changes will include further global warming (i.e., an upward trend in global mean temperature), sea level rise, and a probable increase in the frequency of some extreme weather events. United Nations Framework Convention on Climate Change has agreed to implement policies designed to reduce their emissions of greenhouse gases.
3.2. Effect of climate change
The phrase climate change is used to describe a change in the climate, measured in terms of its statistical properties, e.g., the global mean surface temperature. In this context, climate is taken to mean the average weather. Climate can change over period of time ranging from months to thousands or millions of years. The classical time period is 30 years, as defined by the World Meteorological Organization. The climate change referred to may be due to natural causes, e.g., changes in the sun's output, or due to human activities, e.g., changing the composition of the atmosphere. Any human-induced changes in climate will occur against the background of natural climatic variations.Climate change reflects a change in the energy balance of the climate system, i.e. changes the relative balance between incoming solar radiation and outgoing infrared radiation from Earth. When this balance changes it is called "radiative forcing", and the calculation and measurement of radiative forcing is one aspect of the science of climatology. The processes that cause such changes are called "forcing mechanisms". Forcing mechanisms can be either "internal" or "external". Internal forcing mechanisms are natural processes within the climate system itself, e.g., the meridional turnover. External forcing mechanisms can be either natural (e.g., changes in solar output) or anthropogenic (e.g., increased emissions of greenhouse gases).
Whether the initial forcing mechanism is internal or external, the response of the climate system might be fast (e.g., a sudden cooling due to airborne volcanic ash reflecting sunlight), slow (e.g. thermal expansion of warming ocean water), or a combination (e.g., sudden loss of albedo in the arctic ocean as sea ice melts, followed by more gradual thermal expansion of the water). Therefore, the climate system can respond abruptly, but the full response to forcing mechanisms might not be fully developed for centuries or even longer.
The most general definition of climate change is a change in the statistical properties of the climate system when considered over long periods of time, regardless of cause, whereas Global warming” refers to the change in the Earth's global average surface temperature. Measurements show a global temperature increase of 1.4 °F (0.78 °C) between the years 1900 and 2005. Global warming is closely associated with a broad spectrum of other climate changes, such as:
- Increases in the frequency of intense rainfall,
- Decreases in snow cover and sea ice,
- More frequent and intense heat waves,
- Rising sea levels, and
- Widespread ocean acidification.
3.2.1. Risk of intense rainfall
There are two studied made here to elaborate the risk of intense rain fall one by United States and other one by United Kingdom. They have warned that these risks are due to extreme climate change, thus we have to curb the global warming issues in phases. The summaries of study are given below:[list="list-style-type: roman-lower;"]
[*]Two 500-Year Floods in Just 15 Years: In the United States, The Great Flood of 1993—devastating communities along the Mississippi River and its tributaries in nine Midwestern states—was one of the most costly disasters. Thousands of Americans were displaced from their homes and forced to leave their lives behind, hundreds of levees failed, and damages soared to an estimated $12 to 16 billion. A mere 15 years later, history is repeating itself in the Midwest as the rainswollen Cedar, Illinois, Missouri and Mississippi Rivers and their tributaries top their banks and levees, leaving hundreds of thousands of people displaced. With rainfall in May-June 2008 about two to three times greater than the long-term average, soybean planting is behind schedule and some crops may have to be replanted. This remarkably quick return of such severe flooding is not anticipated by currently used out-of-date methodologies, but is what we should expect as global warming leads to more frequent and intense severe storms. Inadequate floodplain management is also responsible for the extent of damages from both floods, especially over-reliance on levees and the false sense of security they provide to those who live behind them. About 28 percent of the total new development in the seven states over the past 15 years has been in areas within the 1993 flood events.
The National Wildlife Federation says that to limit the magnitude of changes to the climate and the impacts on communities and wildlife, we must curb global warming pollution. The National Wildlife Federation recommends that policy makers, industry, and individuals take steps to reduce global warming pollution from today’s levels by 80 percent by 2050. That’s a reduction of 20 percent per decade or just 2 percent per year. Science tells us that this is the only way to hold warming in the next century to no more than 2°F. This target is achievable with technologies either available or under development, but we need to start taking action now to avoid the worst impacts (See: www.nwf.org/globalwarming).
[*]Extreme rainfall and flood risk in the UK: Multi-day rainfall events are an important cause of recent severe flooding in the UK and any change in the magnitude of such events may have severe impacts upon urban structures such as dams, urban drainage systems and flood defences and cause failures to occur. Regional pooling of 1-, 2-, 5- and 10-day annual maxima for 1961 to 2000 from 204 sites across the UK is used in a standard regional frequency analysis to produce GEV growth curves for long return-period rainfall events for each of nine defined climatological regions. Temporal changes in 1-, 2-, 5- and 10-day annual maxima are examined with L-moments using both a 10-year moving window and fixed decades from 1961-70, 1971-80, 1981-90 and 1991-2000. A bootstrap technique is then used to assess uncertainty in the fitted decadal growth curves and to identify significant trends in both distribution parameters and quantile estimates.
There has been a two-part change in extreme rainfall event occurrence across the UK from 1961-2000. Little change is observed at 1- and 2-day duration, but significant decadal level changes are seen in 5- and 10-day events in many regions. In the south of the UK, growth curves have flattened and 5- and 10-day annual maxima have decreased during the 1990s. However, in the north, the 10-day growth curve has steepened and annual maxima have risen during the 1990s. This is particularly evident in Scotland. The 50-year event in Scotland during 1961-1990 has become an 8-, 11- and 25-year event in the Eastern, Southern and Northern Scotland pooling regions respectively during the 1990s. In northern England the average recurrence interval has also halved. This may have severe implications for design and planning practices in flood control.
Increasing flood risk is now recognised as the most important sectoral threat from climate change in most parts of the world, with recent repeated severe flooding in the UK and Europe causing major loss of property and life, and causing the insurance industry to threaten the withdrawal of flood insurance cover from millions of UK households. This has prompted public debate on the apparent increased frequency of extremes and focussed attention in particular on perceived increases in rainfall intensities. Climate model integrations predict increases in both the frequency and intensity of heavy rainfall in the high latitudes under enhanced greenhouse conditions. These projections are consistent with recent increases in rainfall intensity seen in the UK and worldwide.
[/list]
3.2.2. Decreases in snow cover and sea ice
Decreasing snow cover and land-ice extent continue to be positively correlated with increasing land-surface temperatures: Satellite data show that it is quite likely to have been decreases of about 10% in the extent of snow cover since the late 1960s. There is a highly significant correlation between increases in Northern Hemisphere land temperatures and the decreases. There is now ample evidence to support a major retreat of alpine and continental glaciers in response to 20th century warming. In a few maritime regions, increases in precipitation due to regional atmospheric circulation changes have overshadowed increases in temperature in the past two decades, and glaciers have re-advanced. Over the past 100 to 150 years, ground-based observations show that there is possibility of a reduction of about two weeks in the annual duration of lake and river ice in the mid- to high latitudes of the Northern Hemisphere (Fig.2).
Figure 2.
Time-series of relative sea level for the past 300 years from Northern Europe: Amsterdam, Netherlands; Brest, France; Sheerness, UK; Stockholm, Sweden (detrended over the period 1774 to 1873 to remove to first order the contribution of post-glacial rebound); Swinoujscie, Poland (formerly Swinemunde, Germany); and Liverpool, UK. Data for the latter are of "Adjusted Mean High Water" rather than Mean Sea Level and include a nodal (18.6 year) term. The scale bar indicates ±100 mm.
Northern Hemisphere sea-ice amounts are decreasing, but no significant trends in Antarctic sea-ice extent are apparent: A retreat of sea-ice extent in the Arctic spring and summer of 10 to 15% since the 1950s is consistent with an increase in spring temperatures and, to a lesser extent, summer temperatures in the high latitudes. There is little indication of reduced Arctic sea-ice extent during winter when temperatures have increased in the surrounding region. By contrast, there is no readily apparent relationship between decadal changes of Antarctic temperatures and sea-ice extent since 1973. After an initial decrease in the mid-1970s, Antarctic sea-ice extent has remained stable, or even slightly increased.
New data indicate that there likely has been an approximately 40% decline in Arctic sea-ice thickness in late summer to early autumn between the period of 1958 to 1976 and the mid-1990s, and a substantially smaller decline in winter: The relatively short record length and incomplete sampling limit the interpretation of these data. Interannual variability and inter-decadal variability could be influencing these changes.
3.2.3. More frequent and intense heat waves
A recent study shows that an increase in heat-absorbing greenhouse gases intensifies an unusual atmospheric circulation pattern already observed during heat waves in Europe and North America. As the pattern becomes more pronounced, severe heat waves occur in the Mediterranean region and the southern and western United States. Other parts of France, Germany and the Balkans also become more susceptible to severe heat waves. "Extreme weather events will have some of the most severe impacts on human society as climate changes, "says Meehl.Heat waves can kill more people in a shorter time than almost any other climate event. According to records, 739 people died as a result of Chicago's July, 1995, heat wave. Fifteen thousand Parisians are estimated to have died from heat in August, 2003, along with thousands of farm animals. For the study, Meehl and Tebaldi compared present (1961-1990) and future (2080-2099) decades to determine how greenhouse gases and sulfate aerosols might affect future climate in Europe and the United States, focusing on Paris and Chicago. They assumed little policy intervention to slow the buildup of greenhouse gases. During the Paris and Chicago heat waves, atmospheric pressure rose to values higher than usual over Lake Michigan and Paris, producing clear skies and prolonged heat. In the model, atmospheric pressure increases even more during heat waves in both regions as carbon dioxide accumulates in the atmosphere.
Heat wave is based on the concept of exceeding specific thresholds, thus allowing analyses of heat wave duration and frequency. Three criteria were used to define heat waves in this way, which relied on two location-specific thresholds for maximum temperatures. Threshold 1 (T1) was defined as the 97.5th percentile of the distribution of maximum temperatures in the observations and in the simulated present-day climate (seasonal climatology at the given location), and T2 was defined as the 81st percentile. A heat wave was then defined as the longest period of consecutive days satisfying the following three conditions:
[list="list-style-type: roman-lower;"]
[*]The daily maximum temperature must be above T1 for at least 3 days,
[*]The average daily maximum temperature must be above T1 for the entire period, and
[*]The daily maximum temperature must be above T2 for every day of the entire period.
[/list]
Because the Chicago heat wave of 1995 and the Paris heat wave of 2003 had particularly severe impacts, we chose grid points from the model that were close to those two locations to illustrate heat wave characteristics. This choice was subjective and illustrative given that there are, of course, other well-known heat waves from other locations. Also, we are not suggesting that a model grid point is similar to a particular weather station; we picked these grid points because they represent heat wave conditions for regions representative of Illinois and France in the model, and therefore they can help identify processes that contribute to changes in heat waves in the future climate in those regions. We chose comparable grid points from the National Centers for Environmental Prediction (NCEP)/NCAR reanalyses that used assimilated observational data for comparison to the model results.
Heat waves in Chicago, Paris, and elsewhere in North America and Europe will become more intense, more frequent and longer lasting in the 21st century, according to a new modeling study by two scientists at the National Center for Atmospheric Research (NCAR) in Boulder, Colo. In the United States, heat waves will become most severe in the West and South. The findings appear in the August 13(2004) issue of the journal Science. Gerald Meehl and Claudia Tebaldi, both of NCAR, examined Earth's future climate using the Parallel Climate Model, developed by NCAR and the U.S. Department of Energy (DOE).
During the 1995 Chicago heat wave, the most severe health impacts resulted from the lack of cooling relief several nights in a row, according to health experts. In the model, the western and southern United States and the Mediterranean region of Europe experience a rise in nighttime minimum temperatures of more than 3 degrees Celsius (5.4 degrees Fahrenheit) three nights in a row. They will occur more often: The average number of heat waves in the Chicago area increases in the coming century by 25 percent, from "Heat Waves of the 21st Century: More Intense, More Frequent and Longer Lasting." (Source: PHYSorg.com. 12 Aug 2004, http://phys.org/news806.html Page 1/21.66 per year to 2.08).
In Paris, the average number increases 31percent, from 1.64 per year to 2.15. They will last longer: Chicago's present heat waves last from 5.39 to 8.85 days; future events increase to between 8.5 and 9.24 days. In Paris, present-day heat waves persist from 8.33 to 12.69 days; they stretch to between 11.39 and 17.04 days in future decades.(Source: National Science Foundation)
3.2.4. Observed changes in sea level
Based on tide gauge data, the rate of global mean sea level rise during the 20th century is in the range 1.0 to 2.0 mm/yr, with a central value of 1.5 mm/yr (the central value should not be interpreted as a best estimate.[list="list-style-type: roman-lower;"]
[*]The causes for change of the sea level: At the shoreline it is determined by many factors in the global environment that operate on a great range of time-scales, from hours (tidal) to millions of years (ocean basin changes due to tectonics and sedimentation). On the time-scale of decades to centuries, some of the largest influences on the average levels of the sea are linked to climate and climate change processes.
Firstly, as ocean water warms, it expands. On the basis of observations of ocean temperatures and model results, thermal expansion is believed to be one of the major contributors to historical sea level changes. Further, thermal expansion is expected to contribute the largest component to sea level rise over the next hundred years. Deep ocean temperatures change only slowly; therefore, thermal expansion would continue for many centuries even if the atmospheric concentrations of greenhouse gases were to stabilise.
The amount of warming and the depth of water affected vary with location. In addition, warmer water expands more than colder water for a given change in temperature. The geographical distribution of sea level change results from the geographical variation of thermal expansion, changes in salinity, winds, and ocean circulation. The range of regional variation is substantial compared with the global average sea level rise.
[*]Rise in sea Level: Sea level also changes when the mass of water in the ocean increases or decreases. This occurs when ocean water is exchanged with the water stored on land. The major land store is the water frozen in glaciers or ice sheets. Indeed, the main reason for the lower sea level during the last glacial period was the amount of water stored in the large extension of the ice sheets on the continents of the Northern Hemisphere. After thermal expansion, the melting of mountain glaciers and ice caps is expected to make the largest contribution to the rise of sea level over the next hundred years. These glaciers and ice caps make up only a few per cent of the world's land-ice area, but they are more sensitive to climate change than the larger ice sheets in Greenland and Antarctica, because the ice sheets are in colder climates with low precipitation and low melting rates. Consequently, the large ice sheets are expected to make only a small net contribution to sea level change in the coming decades.
[/list]
3.2.5. Widespread ocean acidification
A new study says the seas are acidifying ten times faster today than 55 million years ago when a mass extinction of marine species occurred. And, the study concludes, current changes in ocean chemistry due to the burning of fossil fuels may portend a new wave of die-offs. In other words, the vast clouds of shelled creatures in the deep oceans had virtually disappeared. Many scientists now agree that this change was caused by a drastic drop of the ocean’s pH level. The seawater became so corrosive that it ate away at the shells, along with other species with calcium carbonate in their bodies. It took hundreds of thousands of years for the oceans to recover from this crisis, and for the sea floor to turn from red back to white. The clay that the crew of the JOIDES Resolution dredged up may be an ominous warning of what the future has in store. By spewing carbon dioxide into the air, we are now once again making the oceans more acidic.3.3. Historical impacts of climate change
Approximately one millennium after the 7 Ka (32nd Century BCE) slowing of sea-level rise, many coastal urban centers rose to prominence around the world (Day, John W., et al. 2007). It has been hypothesized that this is correlated with the development of stable coastal environments and ecosystems and an increase in marine productivity (also related to an increase in temperatures), which would provide a food source for hierarchical urban societies.The last written records of the Norse Greenlanders are from a 1408 marriage in the church of Hvalsey — today the best-preserved of the Norse ruins. Climate change has been associated with the historical collapse of civilizations, cities and dynasties. Notable examples of this include the Anasazi (Demenocal, P. B. 2001), Classic Maya (Hodell, David A., 1995), the Harappa, the Hittites, and Ancient Egypt (Jonathan Cowie, 2007). Other, smaller communities such as the Viking settlement of Greenland (transl. with introd. by Magnus Magnusson, 1983), have also suffered collapse with climate change being a suggested contributory factor (Diamond, Jared, 2005).
There are two proposed methods of Classic Maya collapse: environmental and non-environmental. The environmental approach uses paleoclimatic evidence to show that movements in the intertropical convergence zone likely caused severe, extended droughts during a few time periods at the end of the archaeological record for the classic Maya (Haug, Gh, et al., 2003). The non-environmental approach suggests that the collapse could be due to increasing class tensions associated with the building of monumental architecture and the corresponding decline of agriculture (Hosler D, et al., 1977), increased disease (Santley, Robert S.,et al., 1986) and increased internal warfare (Foias, Antonia E., et al.,1997). The Harappa and Indus civilizations were affected by drought 4,500–3,500 years ago. A decline in rainfall in the Middle East and Northern India 3,800–2,500 is likely to have affected the Hittites and Ancient Egypt.
Notable periods of climate change in recorded history include the medieval warm period and the little ice age. In the case of the Norse, the medieval warm period was associated with the Norse age of exploration and arctic colonization, and the later colder periods led to the decline of those colonies (Patterson, W.P., et al., 2007). Climate change in the recent past may be detected by corresponding changes in settlement and agricultural patterns. Archaeological evidence, oral history and historical documents can offer insights into past changes in the climate. Climate change effects have been linked to the collapse of various civilizations.
3.4. Global warming impacts of climate change
According to different levels of future global warming, impacts of climate has been used in the IPCC's Assessment Reports on climate change (Schneider DH, et al., 2007). The instrumental temperature record shows global warming of around 0.6 °C over the entire 20th century (IPCC 2007d.1). The future level of global warming is uncertain, but a wide range of estimates (projections) have been made (Fisher, BS et al., 2007). The IPCC's "SRES" scenarios have been frequently used to make projections of future climate change (Karl, 2009). Climate models using the six SRES "marker" scenarios suggest future warming of 1.1 to 6.4 °C by the end of the 21st century (above average global temperatures over the 1980 to 1999 time period as shown in Fig.3) (IPCC 2007d.3). The projected rate of warming under these scenarios would very likely be without precedent during at least the last 10,000 years (IPCC 2001-SPM). The most recent warm period comparable to these projections was the mid-Pliocene, around 3 million years ago (Stern N., 2008). At that time, models suggest that mean global temperatures were about 2–3 °C warmer than pre-industrial temperatures (Jansen E., et al., 2007).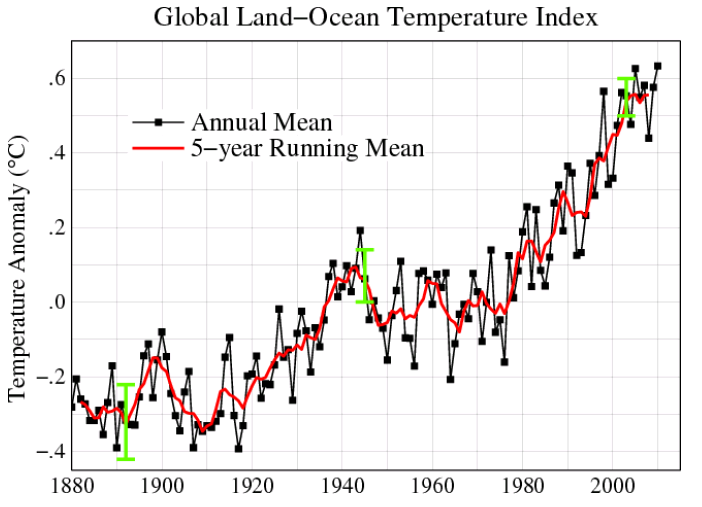
Figure 3.
Global Land-Ocean, mean surface temperature difference from the average for 1880–2009 (Courtesy: Wikipedia.com)
The most recent report IPCC projected that during the 21st century the global surface temperature is likely to rise a further1.1 to 2.9 °C (2 to 5.2 °F) for the lowest emissions scenario used in the report and 2.4 to 6.4 °C (4.3 to 11.5 °F) for the highest (Fig.4).
3.5. Physical impacts of climate change
Working Group I's contribution to the IPCC Fourth Assessment Report, published in 2007, concluded that warming of the climate system was "unequivocal” (Solomon S, 2007a). This was based on the consistency of evidence across a range of observed changes, including increases in global average air and ocean temperatures, widespread melting of snow and ice, and rising global average sea level(Solomon S, 2007b).Human activities have contributed to a number of the observed changes in climate (Hegerl GC, et. al., 2007). This contribution has principally been through the burning of fossil fuels, which has led to an increase in the concentration of GHGs in the atmosphere. This increase in GHG concentrations has caused a radiative forcing of the climate in the direction of warming. Human-induced forcing of the climate has likely to contributed to a number of observed changes, including sea level rise, changes in climate extremes (such as warm and cold days), declines in Arctic sea ice extent, and to glacier retreat (Fig.5 & 6).
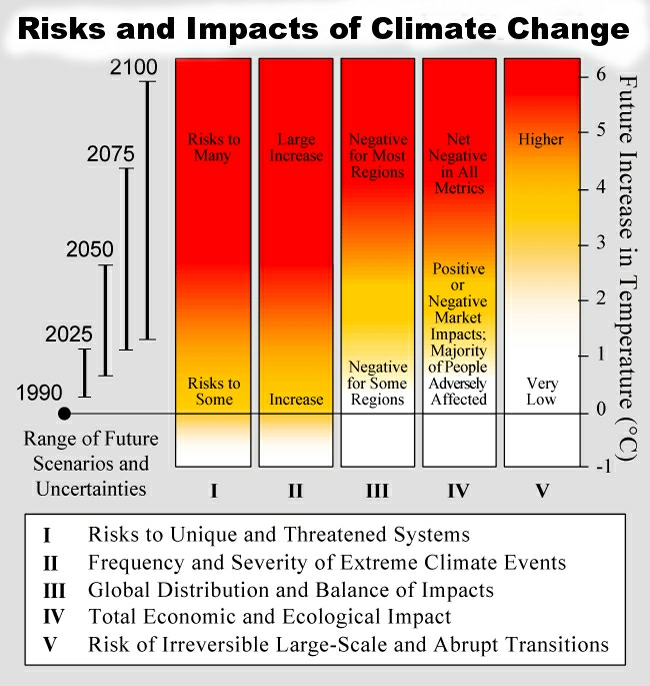
Figure 4.
Projected Global Temperature Rise 1.1 to 6.4 °C during 21st century (Courtesy: Wikipedia.com)

Figure 5.
Decline in thickness of glaciers worldwide over the past half-century

Figure 6.
Key climate indicators that show global warming (Courtesy: Wikipedia.com)
Human-induced warming could potentially lead to some impacts that are abrupt or irreversible. The probability of warming having unforeseen consequences increases with the rate, magnitude, and duration of climate change.
3.6. Climate change effects on weather
Observations show that there have been changes in weather (Le Treut H, et. al., 2007). As climate changes, the probabilities of certain types of weather events are affected. Changes have been observed in the amount, intensity, frequency, and type of precipitation. Widespread increases in heavy precipitation have occurred, even in places where total rain amounts have decreased. IPCC (2007d) concluded that human influences had, more likely than not (greater than 50% probability, based on expert judgment), contributed to an increase in the frequency of heavy precipitation events. Projections of future changes in precipitation show overall increases in the global average, but with substantial shifts in where and how precipitation falls. Climate models tend to project increasing precipitation at high latitudes and in the tropics (e.g., the south-east monsoon region and over the tropical Pacific) and decreasing precipitation in the sub-tropics (e.g., over much of North Africa and the northern Sahara).Evidence suggests that, since the 1970s, there have been substantial increases in the intensity and duration of tropical storms and hurricanes. Models project a general tendency for more intense but fewer storms outside the tropics.
3.7. Extreme weather, tropical cyclone, and list of atlantics hurricane records
Since the late 20th century, changes have been observed in the trends of some extreme weather and climate events, e.g., heat waves. Human activities have, with varying degrees of confidence, contributed to some of these observed trends. Projections for the 21st century suggest continuing changes in trends for some extreme events (Fig.7). Solomon et al. (2007), for example, projected the following likely (greater than 66% probability, based on expert judgment) changes:- an increase in the areas affected by drought;
- increased tropical cyclone activity; and
- increased incidence of extreme high sea level (excluding tsunamis).
Projected changes in extreme events will have predominantly adverse impacts on ecosystems and human society.
3.7.1. Triggering earthquakes, tsunamis, avalanches and volcanic eruptions
Scientists are to outline dramatic evidence that global warming threatens the planet in a new and unexpected way – by triggering earthquakes, tsunamis, avalanches and volcanic eruptions. It is assessed that the Melting glaciers will set off avalanches, floods and mud flows in the Alps and other mountain ranges; torrential rainfall in the UK is likely to cause widespread erosion; while disappearing Greenland and Antarctic ice sheets threaten to let loose underwater landslides, triggering tsunamis that could even strike the seas around Britain.At the same time the disappearance of ice caps will change the pressures acting on the Earth's crust and set off volcanic eruptions across the globe. Life on Earth faces a warm future – and a fiery one.

Figure 7.
Accumulated cyclone energy in the Atlantic Ocean and the sea surface temperature difference which influences such, measured by the U.S. NOAA.
Not only are the oceans and atmosphere conspiring against us, bringing baking temperatures, more powerful storms and floods, but the crust beneath our feet seems likely to join in too, said Professor Bill McGuire, director of the Benfield Hazard Research Centre, at University College London (UCL).
Maybe the Earth is trying to tell us something, added McGuire, who is one of the organisers of UCL's Climate Forcing of Geological Hazards. Some of the key evidence will come from studies of past volcanic activity. These indicate that when ice sheets disappear the number of eruptions increases, said Professor David Pyle, of Oxford University's earth sciences department.
The last ice age came to an end between 12,000 to 15,000 years ago and the ice sheets that once covered central Europe shrank dramatically, added Pyle. The impact on the continent's geology can be measured by the jump in volcanic activity that occurred at this time.
In the Eiffel region of western Germany a huge eruption created a vast caldera, or basin-shaped crater, 12,900 years ago, for example. This has since flooded to form the Laacher See, near Koblenz. Scientists are now studying volcanic regions in Chile and Alaska – where glaciers and ice sheets are shrinking rapidly as the planet heats up – in an effort to anticipate the eruptions that might be set off.
Recently scientists from Northern Arizona University reported in the journal Science that temperatures in the Arctic were now higher than at any time in the past 2,000 years. Ice sheets are disappearing at a dramatic rate – and these could have other, unexpected impacts on the planet's geology.
According to Professor Mark Maslin of UCL, one is likely to be the release of the planet's methane hydrate deposits. These ice-like deposits are found on the seabed and in the permafrost regions of Siberia and the far north. These permafrost deposits are now melting and releasing their methane, said Maslin. You can see the methane bubbling out of lakes in Siberia. And that is a concern, for the impact of methane in the atmosphere is considerable. It is 25 times more powerful than carbon dioxide as a greenhouse gas.

Figure 8.
Earthquake
A build-up of permafrost methane in the atmosphere would produce a further jump in global warming and accelerate the process of climate change. Even more worrying, however, is the impact of rising sea temperatures on the far greater reserves of methane hydrates that are found on the sea floor. It was not just the warming of the sea that was the problem, added Maslin. As the ice around Greenland and Antarctica melted, sediments would pour off land masses and cliffs would crumble, triggering underwater landslides that would break open more hydrate reserves on the sea-bed. Again there would be a jump in global warming. These are key issues that we will have to investigate over the next few years, he said.
There is also a danger of earthquakes, triggered by disintegrating glaciers, causing tsunamis off Chile, New Zealand and Newfoundland in Canada, NASA scientist Tony Song said recently (Fig.8). The last on this list could even send a tsunami across the Atlantic, one that might reach British shores. From other experts, it is said that the risk posed by melting ice in mountain regions, which would pose significant dangers to local people and tourists. The Alps, in particular, face a worryingly uncertain future, said Jasper Knight of Exeter University. Rock walls resting against glaciers will become unstable as the ice disappears and so set off avalanches. In addition, increasing melt-waters will trigger more floods and mud flows.
For the Alps this is a serious problem. Tourism is growing there, while the region's population is rising. Managing and protecting these people was now an issue that needed to be addressed as a matter of urgency, Knight said. "Global warming is not just a matter of warmer weather, more floods or stronger hurricanes. It is a wake-up call to Terra Firma," McGuire said.
3.7.2. Major storms could submerge New York city in next decade
Sea-level rise due to climate change could cripple the city in Irene-like storm scenarios, new climate report claims Irene-like storms of the future would put a third of New York City streets under water and flood many of the tunnels leading into Manhattan in under an hour because of climate change, a new state government report warns Wednesday 16th Nov’ 2011 (Fig.9).Sea level rise due to climate change would leave lower Manhattan dangerously exposed to flood surges during major storms, the report, which looks at the impact of climate change across the entire state of New York, warns. The risks and the impacts are huge, said Art deGaetano, a climate scientist at Cornell University and lead author of the ClimAID study. Clearly areas of the city that are currently inhabited will be uninhabitable with the rising of the sea.
Factor in storm surges, and the scenario becomes even more frightening, he said. Subway tunnels get affected, airports - both LaGuardia and Kennedy sit right at sea level - and when you are talking about the lowest areas of the city you are talking about the business districts. The report, commissioned by the New York State Energy Research and Development Authority, said the effects of sea level rise and changing weather patterns would be felt as early as the next decade.

Figure 9.
The Manhattan skyline as Hurricane Irene approached
By the mid-2020s, sea level rise around Manhattan and Long Island could be up to 10 inches, assuming the rapid melting of polar sea ice continues. By 2050, sea-rise could reach 2.5ft and more than 4.5ft by 2080 under the same conditions. In such a scenario, many of the tunnels - subway, highway, and rail - crossing into the Bronx beneath the Harlem River, and under the East River would be flooded within the hour, the report said. Some transport systems could be out of operation for up to a month.
The report, which was two years in the making, was intended to help the New York state government take steps now to get people out of harm's way - and factor climate change into long-term planning to protect transport, water and sewage systems. New York mayor Michael Bloomberg was so concerned that he went on to commission an even more detailed study of the city after receiving early briefings on the report. That makes him an outlier among his fellow Republicans, who blocked funds for creating a new climate service in budget negotiations in Congress this week.
DeGaetano said climate change would force governments to begin rethinking infrastructure. Most of New York City's power plants, water treatment plants, and sewage systems are right at sea level. City planners are also going to have to help people adapt. More than half a million people live in the New York flood plain, and, as the report noted, a significant portion of them are African American and Latinos. And floods are not the only potential danger of climate change. The report notes that New York could face average annual temperature rises of up to 5 degrees Fahrenheit by the middle of this century and by as much as 9 degrees by 2080.
In summer months, this could subject New Yorkers to power shortages and the risk of black-outs because of the extra need for air conditioning. Those without air conditioning - or who cannot afford the higher electricity bills - would be at greater risk of heat stroke. Those hotter conditions would have effects right across the state, playing havoc with New York State’s wine and agricultural industries. Spruce and Fir trees would disappear from the Catskills and West Hudson River Valley, dairy cows would suffer heat stress, and popular apple varieties would decline, the report said.
4. IPCC expected to confirm link between climate change and extreme weather
Climate change is likely to cause more storms, floods, droughts, heatwaves and other extreme weather events, according to the most authoritative review yet of the effects of global warming. Report likely to conclude that man-made emissions are increasing the frequency of storms, floods and droughts on Thursday- 17 November 2011 16.32 GMT from New York. The Intergovernmental Panel on Climate Change will publish on 18 November 2011, its first special report on extreme weather, and its relationship to rising greenhouse gas emissions. The final details are being fought over by governments, as the "summary for policymakers" of the report has to be agreed in full by every nation that chooses to be involved. But the conclusions are expected to be that emissions from human activities are increasing the frequency of extreme weather events. In particular, there are likely to be many more heatwaves, droughts and changes in rainfall patterns.Jake Schmidt of the US-based Natural Resources Defense Council said: This report should be a wake-up call to those that believe that climate change is some distant issue that might impact someone else. The report documents that extreme weather is happening now and that global warming will bring very dangerous events in the future. From the report you can see that extreme weather will impact everyone in one way or another. This is a window into the future if our political response doesn't change quickly.
This special report - one of only two that the IPCC is publishing before its 2014 comprehensive assessment of the state of climate change science - is particularly controversial as it deals with the relationship between man-made climate change and damaging events such as storms, floods and droughts. Some climate change skeptics and scientists cast doubt on whether the observed increase in extreme weather events can be attributed directly to human actions, or whether much of it is due to natural variability in the weather (Fig. 10).
The IPCC, a body of the world's leading climate scientists convened by the United Nations, is likely to conclude that extreme weather can be linked to man-made climate change, but that individual weather events can at present only rarely be linked directly to global warming.
The Red Cross warned that disaster agencies were already dealing with the effects of climate change in vulnerable countries across the world. "The findings of this report certainly tally with what the Red Cross Movement is seeing, which is a rise in the number of weather-related emergencies around the world," said Maarten van Aalst, director of the Red Cross / Red Crescent Climate Centre and coordinating lead author of the IPCC report. "We are committed to responding to disasters whenever and wherever they happen, but we have to recognise that if the number of disasters continues to increase, the current model we have for responding to them is simply impossible to sustain."

Figure 10.
A Pakistani mother carries her children through flood waters in 2010. The IPCC report deals with the relationship between man-made climate change and extreme weather. (Photograph: K.M.Chaudary/AP)
Insurers are also worried. Mark Way, of the insurance giant Swiss Re, told the Guardian that the massive increase in insurance claims was causing serious concern. He said that between 1970 and 1989, the insurance industry globally had paid out an average of $5bn a year in weather-related claims, but that this had increased enormously to $27bn a year. Although not all of this was attributable to climate change - increasing population, urbanisation and prosperity also play a major part - he said insurers wanted governments to get to grips with the effects of climate change in order to prepare for likely damage and tackle the causes of global warming.
Mike Hulme at the Tyndall Centre said it would be dangerous for governments to use this report in order to justify directing overseas aid only to those countries that could be proved to be suffering from climate change, rather than other problems. In that scenario, he said: "Funding will no longer go to those who are most at risk from climate-impacts and with low adaptive capacity, but will go to those who are lucky enough to live in regions of the world where weather extremes happen to be most attributable by climate models to human agency. These regions tend to be in mid-to-high latitudes, with lots of good weather data and well calibrated models. So, goodbye Africa."
5. Conclusion
From the various studies and reports, it is evident that the with the current rate of carbon dioxide release in the atmosphere there would not only be the increase in the global temperature, but it will also cause rise in sea, level and increase the frequency of disasters. The following major challenges are noticed from the above study:- Emissions from human activities are increasing the frequency of extreme weather events. In particular, there are likely to be many more heatwaves, droughts and changes in rainfall patterns.
- The temperature is estimated to increase by 2 to 6o Celsius within year 2100, which is a tremendous increase from our current average temperature of 1.7o Celsius (IPCC).
- By the mid-2020s, sea level rise around Manhattan and Long Island could be up to 10 inches, assuming the rapid melting of polar sea ice continues. By 2050, sea-rise could reach 2.5ft and more than 4.5ft by 2080 under the same conditions.
- Global warming threatens the planet in a new and unexpected way – by triggering earthquakes, tsunamis, avalanches and volcanic eruptions.
- Irene-like storms of the future would put a third of New York City streets under water and flood many of the tunnels leading into Manhattan in under an hour because of climate change.
These are few glimpses of future suspects; there may be much more bad implications of evils of climate change globally and humanity will be at high risk, developments will get shattered and rescue efforts will gain higher priorities
Acknowledgement
Authors indebted to extend their thanks to the School of Management Sciences, Technical Campus, Lucknow and Harcourt Butler Technological Institute, Kanpur for providing the support of Library.https://www.intechopen.com/books/global-warming-impacts-and-future-perspective/study-of-impacts-of-global-warming-on-climate-change-rise-in-sea-level-and-disaster-frequency
melkior- Posts : 17503
2015-08-09
Re: Trump prošao pokraj buduće nobelovke za mir kao pokraj turskog groblja
by melkior Tue 24 Sep - 23:03
During the 1995 Chicago heat wave, the most severe health impacts resulted from the lack of cooling relief several nights in a row, according to health experts. In the model, the western and southern United States and the Mediterranean region of Europe experience a rise in nighttime minimum temperatures of more than 3 degrees Celsius (5.4 degrees Fahrenheit) three nights in a row. They will occur more often: The average number of heat waves in the Chicago area increases in the coming century by 25 percent, from "Heat Waves of the 21st Century: More Intense, More Frequent and Longer Lasting." (Source: PHYSorg.com. 12 Aug 2004, http://phys.org/news806.html Page 1/21.66 per year to 2.08).
In Paris, the average number increases 31percent, from 1.64 per year to 2.15. They will last longer: Chicago's present heat waves last from 5.39 to 8.85 days; future events increase to between 8.5 and 9.24 days. In Paris, present-day heat waves persist from 8.33 to 12.69 days; they stretch to between 11.39 and 17.04 days in future decades.(Source: National Science Foundation)
melkior- Posts : 17503
2015-08-09
Re: Trump prošao pokraj buduće nobelovke za mir kao pokraj turskog groblja
by Noor Tue 24 Sep - 23:20
_________________
It's So Good To Be Bad
Noor- Posts : 25907
2017-10-06
Re: Trump prošao pokraj buduće nobelovke za mir kao pokraj turskog groblja
by melkior Tue 24 Sep - 23:42
U posljednjih 10-ak godina napisane su stotine znanstvenih studija sa svih svjetskih sveučilišta koje potvrđuju globalno zagrijavanje i čovjekov utjecaj na isto.Noor wrote:i ode tema....
Evo ti pa čitaj:
The science of climate change
https://www.science.org.au/education/immunisation-climate-change-genetic-modification/science-climate-change
melkior- Posts : 17503
2015-08-09
Re: Trump prošao pokraj buduće nobelovke za mir kao pokraj turskog groblja
by melkior Tue 24 Sep - 23:45
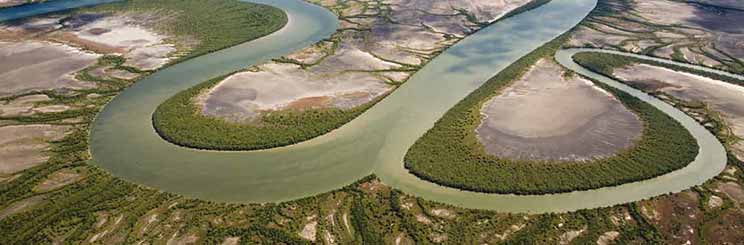 Aerial view of the Norman River flowing towards the Gulf of Carpentaria in far north Queensland. Photo:
 Past climate has varied enormously on a variety of time-scales
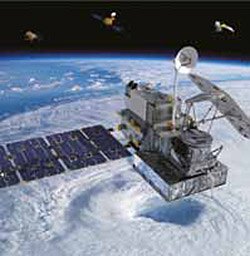 Scientists have been using specialised equipment to measure and record weather and climate since 1850. NASA’s Global Precipitation Measurement (GPM) Core Observatory satellite is designed to provide rain and snow observations worldwide. Visualisation: NASA
Earth’s climate has changed dramatically many times since the planet was formed 4.5 billion years ago. These changes have been triggered by the changing configuration of continents and oceans, changes in the Sun’s intensity, variations in the orbit of Earth, and volcanic eruptions.
Natural variations in the concentrations of greenhouse gases in the atmosphere, the evolution of life and meteorite impacts have also caused climate change in the past. Several million years ago, for example, global average temperature was a few degrees higher than today and warm, tropical waters reached much farther from the equator, resulting in very different patterns of ocean and atmospheric circulation from today.
Over the past million years, Earth’s globally averaged surface temperature has risen and fallen by about 5˚C in ice-age cycles, roughly every 100,000 years or so (Figure 2.1a). In the coldest period of the last ice age, about 20,000 years ago, sea level was at least 120 metres lower than today because more water was locked up on land in polar ice sheets. The last 8,000 years, which includes most recorded human history, have been relatively stable at the warmer end of this temperature range. This stability enabled agriculture, permanent settlements and population growth.
Most past changes in global temperature occurred slowly, over tens of thousands or millions of years. However, there is also evidence that some abrupt changes occurred, at least at regional scales. For example, during the last ice age, temperatures in the North Atlantic region changed by 5°C or more over as little as a few decades, likely due to sudden collapses of Northern Hemisphere ice sheets or changes in ocean currents.
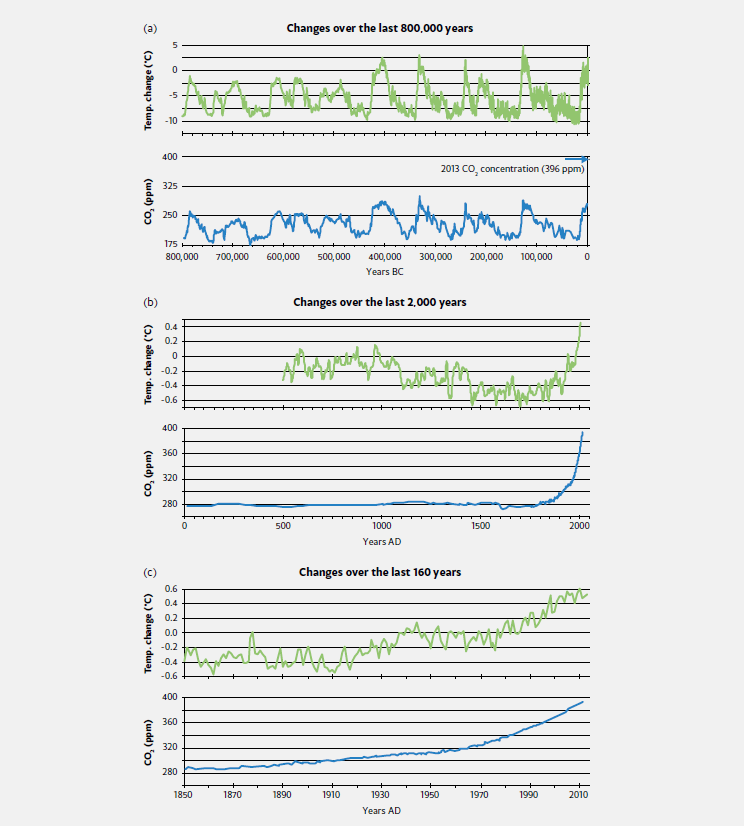 Figure 2.1: Past changes in temperature align with changes in CO2 at a variety of time scales. These graphs show the changes from long‑term average temperature (oC) and average atmospheric CO2 concentration (parts per million) over the last (a) 800,000 years, (b) 2,000 years and (c) 160 years. The temperature changes in (a) are for Antarctica, while for (b) and (c) they are global averages. Source: Compiled from various publicly available data sources as summarised in Box 2.1.
 Tree rings provide one source of climate change data over hundreds of years.
  by LandLearn NSW
Past records demonstrate that global climate is sensitive to small but persistent influences
Ice-age cycles were initiated by small variations in the rotation of Earth and in its orbit around the sun. These changed the seasonal and latitudinal distribution of solar energy reaching Earth’s surface. Measurements from climate archives such as ice cores (Box 2.1) show that changing temperatures triggered changes to other climate factors such as the concentration of carbon dioxide (CO2) in the atmosphere (Figure 2.1a), amplifying the initial disturbances. During warm periods, the major greenhouse gases CO2 and methane were released into the atmosphere, and receding ice sheets reflected less sunlight to space. These observations confirm that the climate system is sensitive to small disturbances that can be amplified by reinforcing feedback processes. Likewise, the climate system today is sensitive to disturbances from human influences.
Box 2.1: How do we detect climate change?
Identifying temperature change that is global in extent requires frequent observations from many locations around the world. Thermometers, rain gauges and other simple instruments have been used to measure climate variables, starting in the mid-19th century. Over time the quality, variety and quantity of observations has improved. Since the 1970s, sophisticated sensors on earth-orbiting satellites have provided near global coverage of many climate variables. By carefully analysing the data gathered using these techniques (with careful account for changes in instrument types, observational practices, instrument locations and urban areas) it has been possible to map the distribution of temperature and other climate changes since the late 19th century.To study climate changes that occurred before direct measurements were made, scientists use indirect evidence from other sources that record a climate signal. These include climate signals encoded in the composition of ice cores, corals, sediments in oceans and lakes, and tree rings. All these records are laid down sequentially over time as an organism grows or as sediments accumulate. Ice cores from polar ice sheets, which are built from snow laid down over tens to hundreds of thousands of years, provide records of both past CO2 and temperature. As the snow transforms into ice, it traps air in sealed bubbles that provide a sample of past atmospheric composition, while the ratio of stable isotopes of either oxygen or hydrogen in the water molecule is related to the temperature at the time when the snow fell. More recent historical changes can be identified by analysing written and pictorial records, for example of changes in glacier extent.
Box 2.2: Has climate warming recently stopped?
According to most estimates, the rate of average surface warming has slowed since 2001, despite ongoing rises in greenhouse gases. This slowdown is consistent with known climate variability. Indeed, decades of little or no temperature trend can be seen throughout the last century, superimposed on the long-term warming trend.Two main factors have contributed to the most recent period of slowed surface warming. First, decadal variability in the ocean-atmosphere system has redistributed heat in the ocean, especially in the eastern and central Pacific. This has caused warming at depth and cooling of surface waters and the lower atmosphere in this region. Second, several temporary global cooling influences have come into play including unusually weak solar activity (Box 3.1), increased aerosol production, and volcanic activity.
None of these influences is likely to continue over the long term. Moreover, despite the slowdown in warming at the surface, there have been continuing increases in heat extremes and in the heat content of the oceans, as well as rising sea levels, shrinking Arctic sea-ice, and ongoing melt of ice sheets and glaciers. Some models predict that, when the current slowdown ends, renewed warming will be rapid.
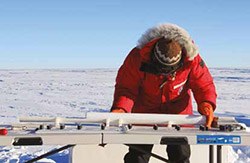 Scientists use ice core samples to reconstruct climatic records over hundreds of thousands of years. by NASA/Lora Koenig
Global average temperatures have increased over the past century
Climate and sea level were relatively stable over thousands of years of recorded human history up to the 19th century, although with some variations (Figure 2.1b). However, globally averaged near-surface air temperature rose by around 0.8°C between 1850 and 2012 (Figure 2.1c). The rate of warming increased in the mid-1970s, and each of the most recent three decades has been warmer than all preceding decades since 1850. The last decade has been the warmest of these. Satellite observations and direct measurements also show warming in the lower atmosphere over the past three decades. In contrast, the atmosphere above about 15 km elevation (the stratosphere) has cooled over this time.
The temperature of the oceans has also risen. More than 90% of the total heat accumulated in the climate system between 1971 and 2010 has been stored in the oceans. The greatest ocean warming has taken place close to the surface, with the upper 75 m of the ocean warming by an average of 0.11°C each decade between 1971 and 2010.
Changes are evident in many parts of the climate system
Changes consistent with an increase in global temperature have been observed in many other components of the climate system.
- Mountain glaciers have been shrinking and contributing to global sea-level rise since about 1850. Melting accelerated significantly in the 1990s.
- The Greenland and West Antarctic Ice Sheets have both lost ice since 1990, further contributing to sea-level rise as discussed in Question 6. This is from increased discharge of ice into the ocean, and also increased surface melting in Greenland. The rate of loss from Greenland appears to be increasing.
- The area of the Arctic Ocean covered by sea ice has decreased significantly since 1987 throughout the year and particularly in summer. The thickness of the ice has also decreased by more than 30% over the last 30 years.
- In the Southern Ocean, there are strong regional differences in the changes to areas covered by sea ice, but a small increase in total coverage, driven by shifts in winds and ocean currents in a warming Southern Ocean. Strengthening circumpolar winds around Antarctica have also been linked in part to thinning of the ozone layer.
- The amount of water vapour in the atmosphere has increased since the 1980s, which is consistent with warmer air (Box 1.3).
- The surface of the ocean in rainy parts of the world is becoming less salty, which is consistent with freshwater dilution from increased rainfall.
- Some ocean currents have changed in response to changes in surface winds, ocean temperature and ocean saltiness. The changes include a southward shift of the Antarctic Circumpolar Current and increasing southward penetration of the East Australian Current.
- An increasing number of plants and animals, on land and in the oceans, are undergoing shifts in their distribution and lifecycles that are consistent with observed temperature changes.
There are regional differences to climate change including within Australia
Over the past 100 years, temperature has increased over almost the entire globe; the rate of increase has been largest in continental interiors (Figure 2.2). The average surface temperatures over the Australian continent and its surrounding oceans have increased by nearly 1°C since the beginning of the 20th century (Figure 2.3). Seven of the ten warmest years on record in Australia have occurred since 2002. However there are differences across Australia with some regions having warmed faster and others showing relatively little warming (Figure 2.3 right).
Since the mid 1990s there have been significant increases in wet season rainfall over northwest Australia (Figure 2.4 left), a declining trend in southwest Australia, and a 15% decline in late autumn and early winter rainfall in the southeast (Figure 2.4 right).
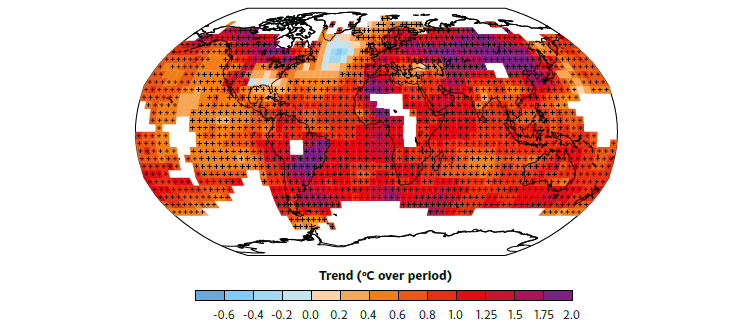 Figure 2.2: Surface temperature has increased across most of the world since 1901. This map shows the distribution of the average temperature change between 1901 and 2012. Adapted from IPCC (2013), Fifth Assessment Report, Working Group 1, Figure 2.21.
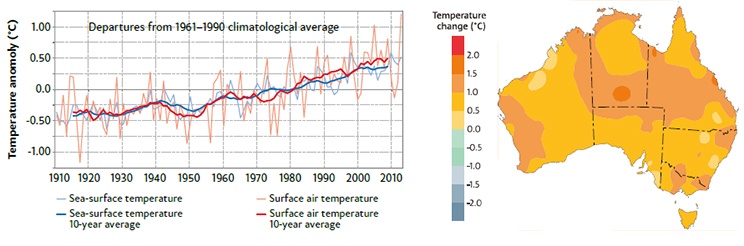 Figure 2.3: Temperature has risen over Australia and in the surrounding ocean since the beginning of the 20th century, although there are regional differences. Plot on left shows deviations from the 1961–1990 average of sea surface temperature and temperatures over land in the Australian region; map on right shows distribution of annual average temperature change across Australia since 1910. Adapted from BOM/CSIRO State of the Climate 2014.
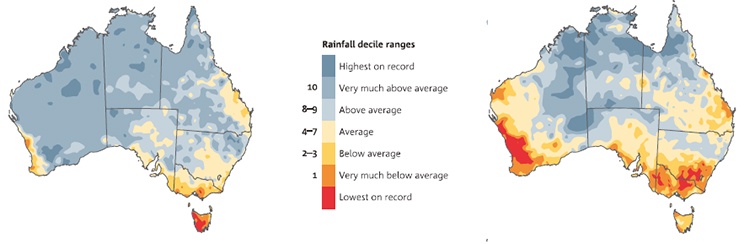 Figure 2.4: Recent rainfall in northern Australia has been higher than average during the northern wet season, and in southern Australia it has been drier during the southern wet season. The maps show the relative ranking (in 10% increments) of rainfall from July 1995 to June 2014 compared with the average since 1900 for (left) northern Australian wet season (Oct–Apr) and (right) southern Australian wet season (Apr–Nov). Adapted from BOM/CSIRO State of the Climate 2014.
 3. Are human activities causing climate change?
 Southern approach to the Sydney Harbour Bridge, NSW. Photo:
 Human activities have increased greenhouse gas concentrations in the atmosphere
Atmospheric concentrations of carbon dioxide (CO2), methane and nitrous oxide began to rise around two hundred years ago, after changing little since the end of the last ice age thousands of years earlier. The concentration of CO2 has increased from 280 parts per million (ppm) before 1800, to 396 ppm in 2013. This history of greenhouse gas concentrations has been established by a combination of modern measurements and analysis of ancient air bubbles in polar ice (Box 2.1).
Particularly important is CO2. Enormous amounts of it are continually exchanged between the atmosphere, land and oceans, as land and marine plants grow, die and decay, and as carbon-rich waters circulate in the ocean. For several thousand years until around 200 years ago, this ‘carbon cycle’ was approximately in balance and steady. Since the 19th century, human-induced CO2 emissions from fossil fuel combustion, cement manufacture and deforestation have disturbed the balance, adding CO2 to the atmosphere faster than it can be taken up by the land biosphere and the oceans (Figures 3.1 and 3.2). On average over the last 50 years, about 25% of total CO2 emissions were absorbed by the ocean making sea water more acidic and 30% was taken up on land, largely by increased plant growth stimulated by rising atmospheric CO2, increased nutrient availability, and responses to warming and rainfall changes (though the mix of these mechanisms remains unclear). The other 45% of emissions accumulated in the atmosphere. These changes to the carbon cycle are known from measurements in the atmosphere, on land and in the ocean, and from modelling studies.
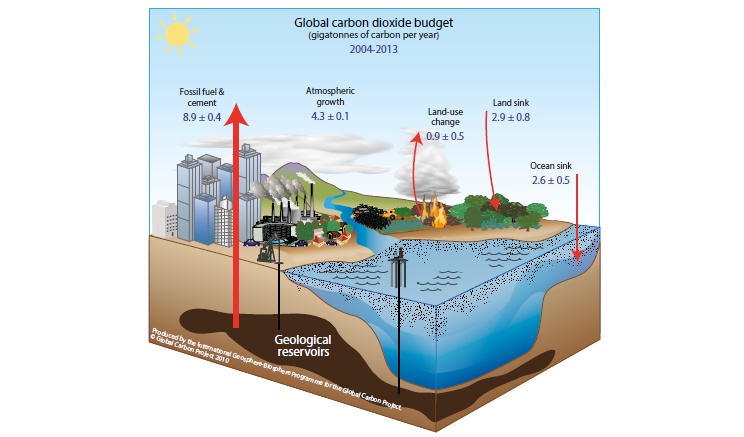 Figure 3.1: The natural carbon cycle, in which CO2 circulates between the atmosphere, land and oceans, has been changed by emissions of CO2 from human activities. In this diagram of the global carbon cycle, numbers on arrows represent carbon flows averaged over 2004–2013, in gigatonnes (billion tonnes) of carbon per year. Source: Global Carbon Project, with updated numbers.
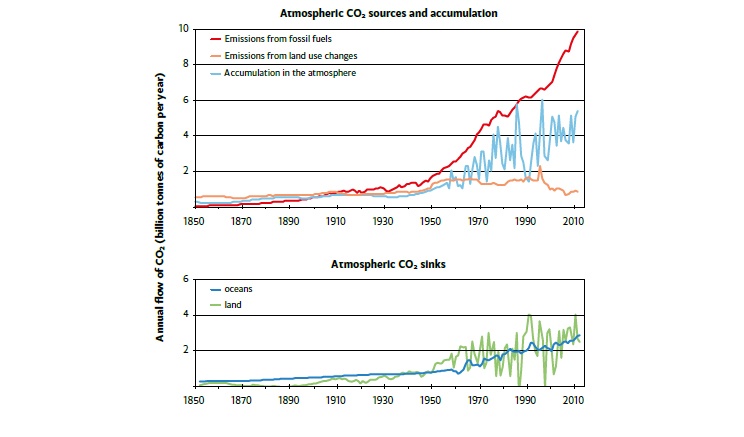 Figure 3.2: An ‘atmospheric CO2 budget’ reveals the amount of carbon in the net amounts of CO2 entering, leaving and accumulating in the atmosphere. The upper panel shows the inflows of CO2 to the atmosphere from fossil fuel emissions (red) and net land use change (orange), together with the net annual CO2 accumulation in the atmosphere (pale blue). The lower panel shows the outflows of CO2 from the atmosphere to the ocean (dark blue) and to plants on land (green). The accumulation in the atmosphere is the difference between the sum of the two emissions and the sum of the two sinks Source: Working Group for this document, with data from the Global Carbon Project. (www.globalcarbonproject.org/)
The dominant cause of the increasing concentration of CO2 in the atmosphere is the burning of fossil fuels. Over the last two centuries, the growth of fossilfuel combustion has been closely coupled to global growth in energy use and economic activity. Fossilfuel emissions grew by 3.2% per year from 2000 to 2010 (Figure 3.3), a rapid growth that is dominated by growth in Asian emissions and has exceeded all but the highest recent long-range scenarios for future emissions.
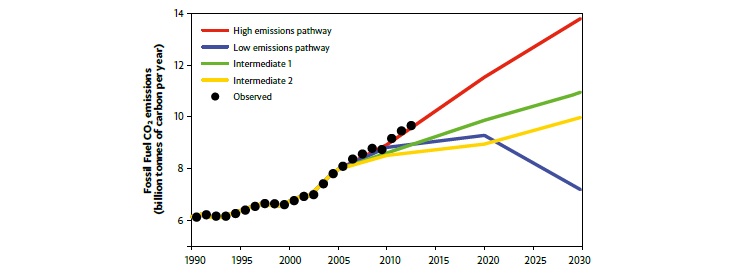 Figure 3.3: CO2 emissions from burning fossil fuels have continued to increase over recent years. The black dots show observed CO2 emissions from fossil fuels and other industrial processes (mainly cement manufacture); the coloured lines represent four future pathways as envisaged in 2006 for low to high emissions. Observed emissions are tracking the highest-emission pathway. Source: Working Group for this document, with data from the Global Carbon Project.
Although fossil-fuel emissions of CO2 have grown fairly steadily, the upward march of the CO2 concentration in the atmosphere varies from year to year. This is caused mainly by the effects of weather variability on vegetation, and also by sporadic volcanic activity: major volcanic eruptions have a significant indirect influence on atmospheric CO2 concentrations, causing temporary drawdown of CO2 through the promotion of plant growth by the light-scattering and cooling effects of volcanic haze. By contrast, the direct contribution of volcanic emissions to atmospheric CO2 is negligible, amounting to around 1% of current humaninduced emissions.
 Wollongong, NSW at night. by Jim Vrckovski
Most of the observed recent global warming results from human activities
Climatic warming or cooling arises from changes in the flows of energy through the climate system (Figure 1.1) that can originate from a number of possible driving factors. The main drivers that have acted over the last century are:
- increases in atmospheric CO2 and other long-lived greenhouse gases (methane, nitrous oxide and halocarbons)
- increases in short-lived greenhouse gases (mainly ozone)
- changes to land cover (replacement of darker forests with paler croplands and grasslands)
- increases in aerosols (tiny particles in the atmosphere)
- solar fluctuations (changes in the brightness of the sun)
- volcanic eruptions.
Of these, solar fluctuations and volcanic eruptions are entirely natural, while the other four are predominantly caused by human influences. The human-induced drivers have been dominant over the past century (Figure 3.4). Changes in greenhouse gas concentrations, dominated by CO2, caused a large warming contribution. Some of this has been offset by the net cooling effects of increased aerosol concentrations and their impact on clouds. Black carbon or soot has probably exerted a smaller, warming influence. The net effect of all aerosol types including soot remains hard to quantify accurately. Among the natural influences, the effect of changes in the brightness of the Sun has been very small (Box 3.1). Volcanic influences are highly intermittent, with major eruptions (such as Pinatubo in 1991) causing significant cooling for a year or two, but their average effects over the past century have been relatively small.
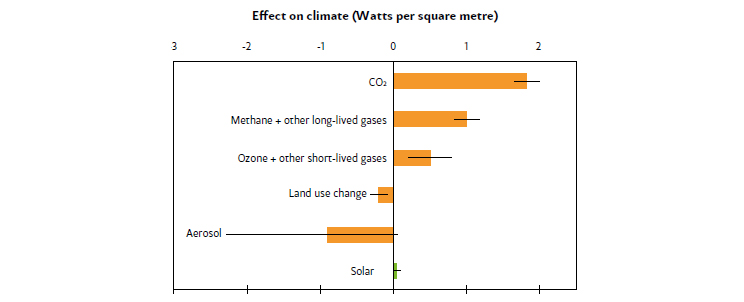 Figure 3.4: Human-induced drivers of climate change have been much larger than natural drivers over the last century. The strength of these drivers, which are changing the long-term energy balance of the planet, is measured in Watts per square metre (see also Figure 1.1). Orange and green bars respectively indicate human and natural drivers; error bars indicate 5-95% uncertainties. The solar effect (shown in green) is very small. Volcanic effects are highly variable in time (see text) and are not shown here. Source: Working Group for this document, with data from IPCC (2013), Fifth Assessment Report, Working Group 1, Chapter 8 Supplementary Material.
Box 3.1: Do changes in the Sun contribute to global warming?
In comparison with other influences, the effects of solar variations on present global warming are small. Indirect estimates suggest that changes in the brightness of the Sun have contributed only a few percent of the global warming since 1750. Direct measurements show a decreasing solar intensity over recent decades, opposite to what would be required to explain the observed warming. Solar activity has declined significantly over the last few years, and some estimates suggest that weak activity will continue for another few decades, in contrast with strong activity through the 20th century. Nevertheless, the possible effects on warming are modest compared with anthropogenic influences.Using climate models, it is possible to separate the effects of the natural and human-induced influences on climate. Models can successfully reproduce the observed warming over the last 150 years when both natural and human influences are included, but not when natural influences act alone (Figure 3.5). This is both an important test of the climate models against observations and also a demonstration that recent observed global warming results largely from human rather than natural influences on climate.
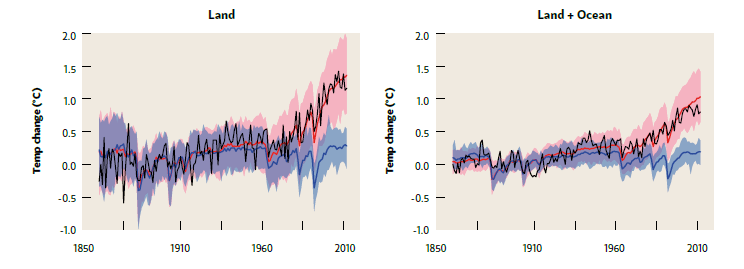 Figure 3.5: Climate models can correctly replicate recent warming only if they include human influences. Comparison of observed changes (black lines) in global temperatures (°C) over land (left) and land plus ocean (right) with model projections including both natural plus human influences (red lines) and natural influences only (blue lines). Shadings around model results indicate 5-95% confidence bands. Adapted from IPCC (2013), Fifth Assessment Report, Working Group 1, Figure 10.21.
It is also possible to distinguish the effects of different human and natural influences on climate by studying particular characteristics of their effects. For example, it was predicted more than a century ago that increases in CO2 would trap more heat near the surface and also make the stratosphere colder. In recent years, satellite and other measurements have provided strong evidence that the upper atmosphere has cooled and the lower atmosphere has warmed significantly—the predicted consequence of extra greenhouse gases. This supports the inference that the observed nearsurface warming is due primarily to an enhanced greenhouse effect rather than, say, an increase in the brightness of the Sun.
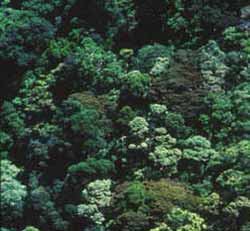 Rainforest canopy, Bellenden Ker Range, North Queensland. by Robert Kerton
Some recent changes in Australia’s climate are linked to rising greenhouse gases
Modelling studies indicate that rising greenhouse gases have made a clear contribution to the recent observed warming across Australia. Depletion of the ozone layer in the upper atmosphere over Antarctica and rising greenhouse gas concentrations are also likely to have contributed significantly to climate trends that have been observed in the Australian region over the past two decades. These include stronger westerly winds over the Southern Ocean, strengthening of the high-pressure ridge over southern Australia, and a related southward shift of weather systems. These trends are consistent with climate model projections, and are likely to be largely human-induced through a combination of increases in greenhouse gases and thinning of the ozone layer.
Past decadal trends in Australian rainfall (Question 2) cannot yet be clearly separated from natural climate variations, except in southwest Western Australia where a significant observed decline in rainfall has been attributed to human influences on the climate system.
There has very likely been net uptake of CO2 by Australian vegetation, consistent with global uptake of CO2 by vegetation on land (Figure 3.2). This has been accompanied by increases in the greenness of Australian vegetation, which is also consistent with global trends.
4. How do we expect climate to evolve in the future?
 Drawing on data from multiple satellite missions, NASA scientists and graphic artists have layered land surface, polar sea ice, city lights, cloud cover and other data in a visualisation of Earth from space. by
NASA Goddard Space Flight Centre/Reto Stöckli
With continued strong growth in CO2 emissions, much more warming is expected
If society continues to rely on fossil fuels to the extent that it is currently doing, then carbon dioxide (CO2) concentrations in the atmosphere are expected to double from pre-industrial values by about 2050, and triple by about 2100. This ‘high emissions’ pathway for CO2, coupled with rises in the other greenhouse gases, would be expected to result in a globalaverage warming of around 4.5°C by 2100, but possibly as low as 3°C or as high as 6˚C. A ‘low emissions’ pathway, based on a rapid shift away from fossil fuel use over the next few decades, would see warming significantly reduced later this century and beyond (Figure 4.1).
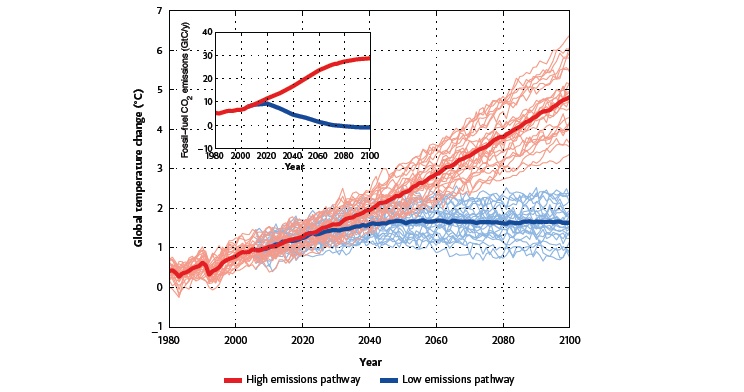 Figure 4.1: Future projected climate change depends on net emissions of greenhouse gases. Retrospective and future projected global surface air temperature changes (°C; relative to 1861–1880) under both high and low emissions pathways. Individual model simulations are shown as faint lines, with bold lines indicating the multi-model average. The corresponding two emissions pathways, including all industrial sources, are included in the inset. Emission units are gigatonnes (billion tonnes) of carbon per year (GtC/y). Source: Data from Coupled Model Intercomparison Project (CMIP) 5.
During the next few decades and beyond, global warming is expected to cause further increases in atmospheric moisture content, more extreme heatwaves, fewer frosts, further decreases in the extent and thickness of sea ice, further melting of mountain glaciers and ice sheets, shifts in rainfall (increases in most tropical and high-latitude regions and decreases in many subtropical and mid-latitude regions), further ocean warming, and further rises in sea levels. The magnitude of expected change depends on future greenhouse gas emissions and climate feedbacks.
Future projections, based on climate models operated across a large number of research centres worldwide, broadly agree on the patterns of global-scale warming, with greater atmospheric warming over land than over the oceans, and greater warming at high northern latitudes than in the tropics and Southern Ocean (Figure 4.2 top). Future changes depend on the emissions pathway, and will be less if emissions are curtailed than under a high emissions scenario. At more localised regional scales the models can produce different results: for example, some models project substantial changes to phenomena such as El Niño or dramatic changes to vegetation, and regional projections of precipitation vary between models (Figure 4.2 bottom).
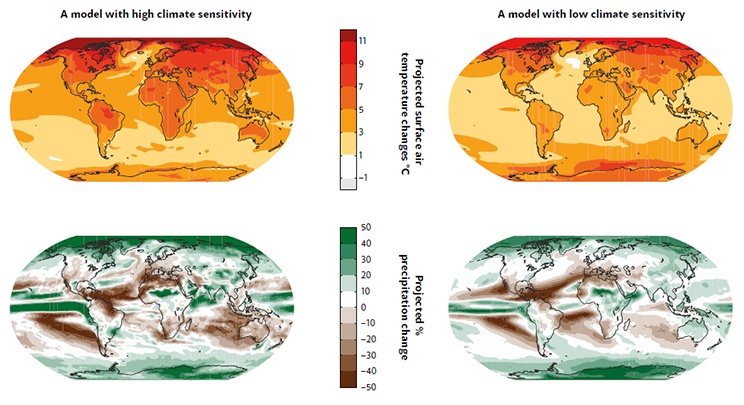 Figure 4.2: Projections of temperature and rainfall show consistent features at large scales but differ regionally, especially for rainfall. Projected global distributions of surface air temperature changes (top) and percentage precipitation change (bottom) averaged for the years 2081–2100 (relative to 1981–2000), under a high emissions pathway for two particular climate models, one with relatively high sensitivity to an initial disturbance to the climate system (left hand panels) and one with relatively low climate sensitivity (right hand panels). The projections have many similar patterns but differ in regional details, as is typical of climate projections from different models. Source: Data from Coupled Model Intercomparison Project 5.
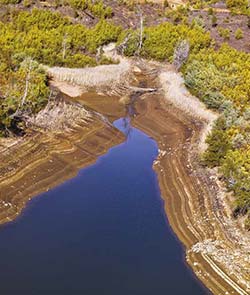 Low water levels in the Cotter Dam near Canberra, ACT. by Nick Pitsas
Australia can expect further warming and changes in water availability
Australian temperatures are expected to rise by approximately half a degree or more by 2030 relative to 1990, bringing more hot days and nights. Average sea level is expected to be about 15 cm higher by 2030 relative to 1990 and some models project tropical cyclones becoming less frequent but more severe in peak rainfall intensity as the world warms.
It is likely that future rainfall patterns across Australia will be different from today. However, compared with temperature trends, changes in rainfall patterns are harder to predict. Regional rainfall projections from different climate models are frequently different from one another (e.g. over Australia; Figure 4.2). Nevertheless, some future trends are projected by a majority of models, including decreases over southwest Western Australia coastal regions. Future rainfall trends across the Murray Darling basin remain uncertain.
Changes in rainfall greatly affect water availability because changes in rainfall are amplified in the resulting changes in runoff to rivers: the runoff in typical Australian catchments changes by 2 to 3% for each 1% change in rainfall.
 1 Bligh St, Sydney, NSW is an energy efficient development with six-star green status. Improving urban energy efficiency will help reduce emissions. by Sardaka
Long-term climate change is effectively irreversible
The decisions we make on carbon emissions over coming decades will affect our climate for a long time to come, as emissions will profoundly impact the rate of future climate change, particularly after 2030 (Figure. 4.1). Even if emissions of greenhouse gases are reduced to near zero during this century, we will have to live with a warmer climate for centuries. For those parts of the climate system that respond slowly, such as the deep ocean, ice sheets and permafrost, change will continue for a long time. Many associated impacts—such as sea-level rise— and processes that exacerbate climate change—such as releases of methane and CO2 from thawing permafrost soils—will continue long after emissions are stopped.
These characteristics of the climate system mean that the only way to stop human-induced climate change (without resorting to ‘geoengineering’—the deliberate, large-scale modification of climate) is to reduce net greenhouse gas emissions to near-zero levels. The longer this takes to achieve, and the more greenhouse gases that are emitted in the meantime, the larger the scale of future climate change.
To keep global warming below any specified threshold, there is a corresponding limit on cumulative carbon dioxide emissions
The amount of future global warming is closely related to cumulative CO2 emissions (Figure 4.3). For example, to have a 50:50 chance of keeping global average temperatures to no more than 2°C above preindustrial levels, the total CO2 emitted from human activities (accounting also for effects of other gases) would have to stay below a ‘carbon quota’ between 820 and 950 billion tonnes of carbon. So far, humanity has emitted well over half of this quota: between 1870 and 2013 cumulative emissions were 530 billion tonnes. The remaining quota is equivalent to around 30 years worth of current emissions. To stay within such a carbon quota, long-term global emissions reductions would have to average between 5.5% and 8% per year, accounting for time required to turn around present emissions growth.
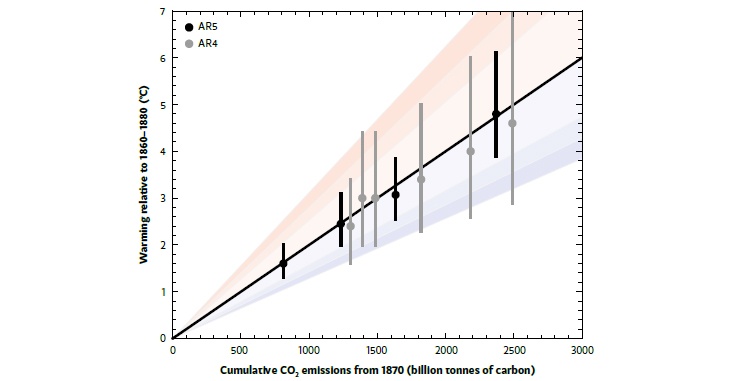 Figure 4.3: Global warming is closely related to cumulative CO2 emissions. Points represent Intergovernmental Panel on Climate Change projections from the Fourth and Fifth Assessments (IPCC AR4, AR5); coloured bands represent uncertainty, by showing the relationship if the climate were more (red) or less (blue) sensitive to disturbance than current best estimates. Source: Working Group for this document, with data from IPCC AR4 and AR5.
https://www.science.org.au/education/immunisation-climate-change-genetic-modification/science-climate-change
melkior- Posts : 17503
2015-08-09
Re: Trump prošao pokraj buduće nobelovke za mir kao pokraj turskog groblja
by melkior Tue 24 Sep - 23:48
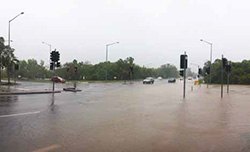 Flooding in Darwin, NT, following tropical cyclone Carlos in 2011. by Charles Strebor
Australia has a variable climate with many extremes
With its iconic reference to ‘droughts and flooding rains’, Dorothea Mackellar’s 1904 poem My Country highlights the large natural variations that occur in Australia’s climate, leading to extremes that can frequently cause substantial economic and environmental disruption. These variations have existed for many thousands of years, and indeed past floods and droughts in many regions have likely been larger than those recorded since the early 20th century. This high variability poses great challenges for recording and analysing changes in climate extremes not just in Australia, but the world over. Nevertheless, some changes in Australia’s climate extremes stand out from that background variability.
Human-induced climate change is superimposed on natural variability
In a warming climate, extremely cold days occur less often and very hot days occur more often (Figure 5.1). These changes have already been observed. For example, in recent decades, hot days and nights have become more frequent, more intense and longer lasting in tandem with decreases in cold days and nights for most regions of the globe. Since records began, the frequency, duration and intensity of heatwaves have increased over large parts of Australia, with trends accelerating since 1970.
 Figure 5.1: Temperature extremes change as average temperature increases. In this schematic illustration, the increase in average temperature is shown by the sloping line on the right. The idealised temperature time series has similar variability throughout the whole record. In the latter part of the record, the hot extremes threshold is exceeded progressively more frequently. Source: Working Group for this document.
Because a warmer atmosphere contains more moisture, rainfall extremes are also expected to become more frequent and intense as global average temperatures increase. This is already being observed globally: heavy rainfall events over most land areas have become more frequent and intense in recent decades, although these trends have varied notably between regions and seasons. In southern Australia, for example, the frequency of heavy rainfall has decreased in some seasons. While there is no clear trend in drought occurrence globally, indications are that droughts have increased in some regions (such as southwest Australia) and decreased in others (such as northwest Australia) since the middle of the 20th century.
For other extreme weather events such as tropical cyclones, there are not yet sufficient good quality observational data to make conclusive statements about past long-term trends. However, as the climate continues to warm, intensification of rainfall from tropical cyclones is expected.
Recent scientific advances now allow us to begin ascribing changes in the climate system to a set of underlying natural and human causes. For example, it is now possible to estimate the contribution of human-induced global warming to the probabilities of some kinds of extreme events. There is a discernible human influence in the observed increases in extremely hot days and heatwaves. While the record high temperatures of the 2012/2013 Australian summer could have occurred naturally, they were substantially more likely to occur because of human influences on climate. By contrast, the large natural variability of other extremes, such as rainfall or tropical cyclones, means that there is still much less confidence in how these are being affected by human influences.
Extremes are expected to change in the future
As the climate continues to warm in response to further greenhouse gas emissions, high temperature extremes will become hotter and cold extremes will become less cold. The rate of change of temperature extremes in Australia will depend on future emission levels: higher emissions will cause progressively more frequent high extreme temperatures (Figure 5.2 left). Climate model projections also suggest (though with considerable uncertainty) that in the next several decades, heavy rainfall events in Australia will tend to increase under a high emissions pathway (Figure 5.2 right). Across the globe, projections point broadly to an intensification of the wettest days and a reduction in the return time of the most extreme events (Figure 5.3), although there is much regional variation in these trends. For Australia, a warmer future will likely mean that extreme precipitation is more intense and more frequent, interspersed with longer dry spells, likewise with substantial regional variability.
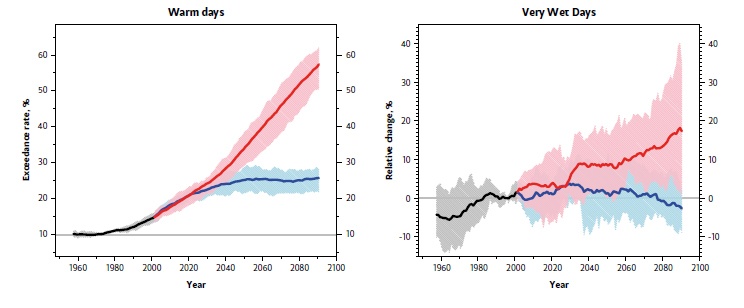 Figure 5.2: Future increases in extreme temperatures in Australia are strongly linked to global greenhouse gas emissions. But future changes in heavy rainfall are much less certain. Plots show Australia wide changes in the percentage of days annually with daily maximum surface air temperature warmer than the temperature exceeded by the hottest 10% of days during 1961–1990; and (right) the percentage change in annual precipitation from the wettest 5% of rainfall days (relative to 1986–2005). Red and blue lines represent outcomes under high-emissions and low-emissions pathways. Source: working group for this document.
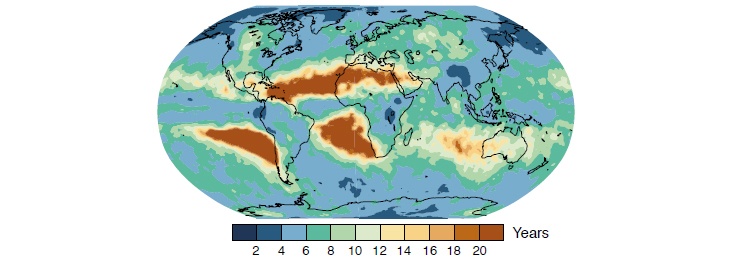 Figure 5.3: Over most continents, a heavy rainfall event that occurs only once in 20 years today is expected to occur at least twice as often by end of the 21st century. The map shows projections, under a high emission pathway, of the return period during 2081–2100 for daily precipitation values that have a 20-year return period during 1986–2005. Adapted from IPCC (2013) Fifth Assessment Report, Working Group 1, Technical Summary, TFE.9, Figure 1f.
In many continents, including Australia, a high temperature event expected once in 20 years at the end of the 21st century is likely to be over 4°C hotter than it is today (Figure 5.4). Furthermore, what we experience as a one-in-20-year temperature today would become an annual or one-in-two-year event by the end of the 21st century in many regions.
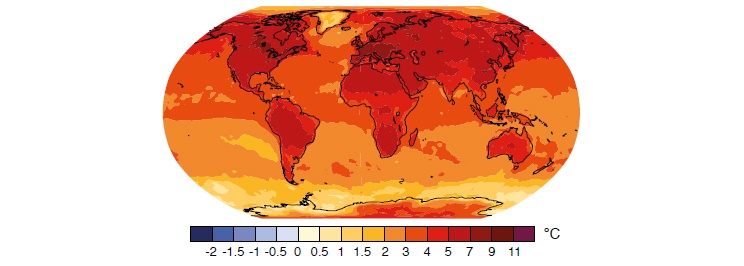 Figure 5.4: The maximum temperature in any 20-year time period is expected to increase with time, being substantially higher at the end of the 21st century than today. The map shows projections under a high emissions pathway of the change from 1986–2005 to 2081–2100 in 20-year return values of daily maximum temperatures. Adapted from IPCC (2013), Fifth Assessment Report, Working Group 1, Technical Summary, TFE.9, Figure 1e.
Future changes in other extreme weather events are less certain. Evidence suggests there will be fewer tropical cyclones, but that the strongest cyclones will produce heavier rainfall than they do currently.
6. How are sea levels changing?
 Coogee Beach sea pool, NSW. by Robert Montgomery
In past warmer climates, sea level was higher than today
Sea level was between 5 metres and 10 metres above current levels during the last interglacial period (129,000 to 116,000 years ago) when global average surface temperatures were less than 2°C above their values just before the start of the industrial era in the 19th century. The estimated contributions from ocean thermal expansion and a then smaller Greenland Ice Sheet imply a contribution also from Antarctica to this higher sea level.
Globally, sea levels are currently rising
For two thousand years before the mid-19th century, the long-term global sea-level change was small, only a few centimetres per century. Since then, the rate of rise has increased substantially; from 1900 to 2012, sea level rose by a global average of about 19 centimetres. In the past 20 years, both satellite and coastal sea-level data indicate that the rate of rise has increased to about 3 centimetres per decade. A similarly high rate was experienced in the 1920 to 1950 period (Figure 6.1).
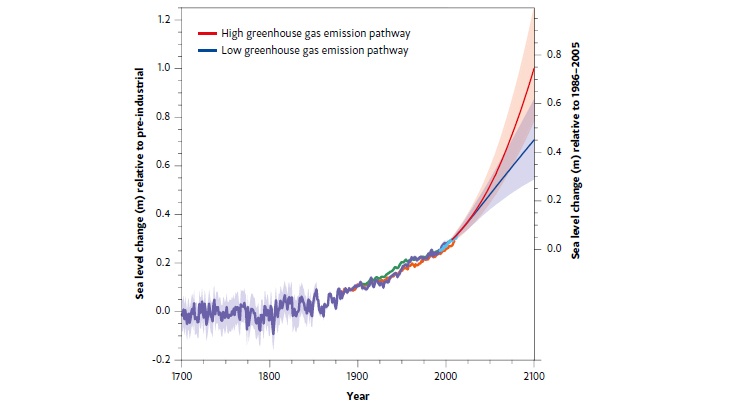 Figure 6.1: Global average sea level has increased from estimated pre-industrial levels and is projected to rise at a faster rate during the 21st century. The blue, orange and green curves up to 2010 are different estimates of global average sea-level change, relative to the pre-industrial level, based on historical tide-gauge observations. The light blue curve is the satellite altimeter observations from 1993 to 2012. Projections, shown from 2006 to 2100, are relative to the average over 1986–2005 for high and low greenhouse gas emission pathways. Adapted from IPCC (2013), Fifth Assessment Report, Working Group 1, Figure 13.27.
The two largest contributions to sea-level rise since 1900 were the expansion of ocean water as it warmed, and the addition of water to the ocean from loss of ice from glaciers. Since 1990, there have been further contributions from surface melting of the Greenland ice sheet, and the increased discharge of ice into the ocean from both the Greenland and Antarctic ice sheets. This increase in ice-sheet discharge is related to increases in ocean temperatures adjacent to and underneath the glacier tongues and floating ice shelves that fringe the coast of Greenland and Antarctica. The sum of storage of water in terrestrial reservoirs and the depletion of ground water have made a small contribution to sealevel rise during the 20th century.
Australian sea levels are rising
Around the Australian coastline, sea level rose relative to the land throughout the 20th century, with a faster rate (partly as a result of natural climate variability) since 1993. This follows several thousand years when there was a slow fall of Australian sea levels relative to the land at rates of a few centimetres per century. This was a result of ongoing changes to the ‘solid’ Earth following loss of the large surface loading from ice sheets of the last ice age.
Sea levels are projected to rise at a faster rate during the 21st century than during the 20th century
By 2100, it is projected that the oceans will rise by a global average of 28 to 61 centimetres relative to the average level over 1986–2005 if greenhouse gas emissions are low, and by 52 to 98 centimetres if emissions are high (Figure 6.1). The largest contributions are projected to be ocean thermal expansion and the loss of ice from glaciers, with the Greenland ice sheet contributing from surface melt and ice discharge into the ocean. For Antarctica, increased snowfall may partially offset an increase in discharge of ice into the ocean. Observations indicate that an increased discharge from Antarctica is occurring, particularly from sectors of the Antarctic ice sheet resting on land below sea level. Recent models successfully simulate increased flow in individual Antarctic glaciers and support the rates of ice sheet loss that were used to estimate global sea level rise of up to 98 cm by 2100. However, the relevant ice-sheet processes are poorly understood and an additional rise of several tens of centimetres by 2100 cannot be excluded.
Regional sea-level change can be different from the global average because of changes in ocean currents, changes in regional atmospheric pressure, the vertical movement of land, and changes in the Earth’s gravitational field as a result of changes in the distribution of water, particularly ice sheets, on the Earth. For Australia, 21st century sea-level rise is likely to be close to the global average rise.
In addition to climate-driven sea-level change, local factors can also be important and may dominate at some locations. These include tectonic land movements and subsidence resulting from the extraction of ground water or hydrocarbons, sediment loading and compaction. Changes in sediment supply can affect local erosion/accretion of the coastline.
Rising sea levels result in a greater coastal flood and erosion risk
Rising average sea levels mean that extreme sea levels of a particular height are exceeded more often during storm surges. For the east and west coasts of Australia, this happened three times more often in the second half compared to the first half of the 20th century. This effect will continue with more than a ten-fold increase in the frequency of extreme sea levels by 2100 at many locations and a much increased risk of coastal flooding and erosion, even for a low emissions pathway.
Sea levels will continue to rise for centuries
By 2300, it is projected that high greenhouse gas emissions could lead to a global sea-level rise of 1 metre to 3 metres or more. This may be an underestimate because it is difficult to accurately simulate the changes in the discharge from the Antarctic and Greenland ice sheets.
Sustained warming would lead to the near-complete loss of the Greenland ice sheet over a thousand years or more, contributing up to about 7 metres to global average sea-level rise. This would occur above a warming threshold estimated to be between about 1°C and 4°C of global average warming relative to pre-industrial temperatures. It is possible that a larger sea-level rise could result from a collapse of sectors of the Antarctic ice sheet resting on land below sea level. Current understanding is insufficient to assess the timing or magnitude of such a multi-century contribution from Antarctica, although there is increasing evidence that it may already have commenced.
7. What are the impacts of climate change?
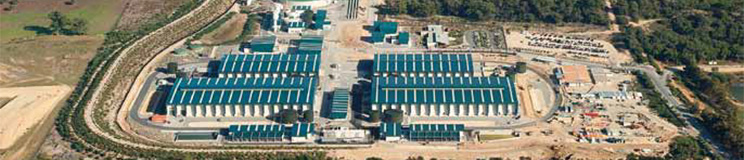 The Southern Seawater Desalination Plant at Binningup, WA, supplies drinking water to Perth. Photo: Darryl Peroni Photography, courtesy of Water Corporation.
Climate changes have always affected societies and ecosystems
Climate change, whatever the cause, has profoundly affected human societies and the natural environment in the past. Throughout history there are examples of societal collapse associated with regional changes in climate, ranging from the decline of the Maya in Mexico (linked to drought) to the disappearance of the Viking community from Greenland in the fifteenth century (linked to decreasing temperatures). Some of these regional climate changes occurred rapidly, on timescales similar to current rates of global climate change.
 Developed by the CSIRO Information and Communications Technology Centre at its Queensland laboratory, Starbug is an autonomous, miniature submarine for underwater monitoring and surveying of ecosystems such as the Great Barrier Reef. by QCAT
Impacts from human-induced climate change are already occurring
The clearest present-day impacts of climate change in Australia and elsewhere are seen in the natural environment, and are associated with warming temperatures and increases in the number, duration and severity of heatwaves. These impacts include changes in the growth and distribution of plants, animals and insects; poleward shifts in the distribution of marine species; and increases in coral bleaching on the Great Barrier Reef and Western Australian reefs. Some of these changes can directly affect human activities; for example, through the effects of changing distributions of fish and other marine organisms on commercial and recreational fisheries, and the impacts of coral bleaching on tourism.
Some regional changes in Australian rainfall have been linked to humaninduced climate change. Southwest Western Australia has experienced a reduction in rainfall since the 1970s that has been attributed, at least in part, to enhanced greenhouse warming (Question 3). Societal adaptation to the resulting shortfalls in water supply is possible and already occurring (Box 7.1).
Box 7.1: Impacts of a drier climate: the case of southwest Western Australia
Declining rainfall and surface reservoir recharge since the mid-1970s in southwest Western Australia have been linked to changes in atmospheric circulation that are consistent with what would be expected in an atmosphere influenced by increasing greenhouse gas concentrations. The Water Corporation of Western Australia is addressing the diminishing surface water resource by setting out to deliver a ‘climate-independent’ supply of water for domestic consumption through two desalination plants. These now have the capacity to provide around half the piped water supply for the wider Perth region at a cost several times greater than that of surface water.Current changes are expected to continue and intensify in the future
The impacts of future climate change and related sea-level rise will be experienced in many areas, from the natural environment to food security and from human health to infrastructure.
Ecosystems: Among Australia’s terrestrial ecosystems, some of the most vulnerable to climate change are (1) alpine systems as habitats shift to higher elevations and shrink in area; (2) tropical and subtropical rainforests due to warming temperatures (moderated or intensified by rainfall changes); (3) coastal wetlands affected by sea-level rise and saline intrusion; (4) inland ecosystems dependent on freshwater and groundwater that are affected by changed rainfall patterns; and (5) tropical savannahs affected by changes in the frequency and severity of bushfires.
Climate warming causes land and ocean life to migrate away from areas that have become too warm, and towards areas that previously were too cool. In many places, climate change is likely to lead to invasion by new species and extinctions of some existing species that will have nowhere to migrate, for example because they are located on mountain tops (Figure 7.1). Seemingly small changes, such as the loss of a key pollinating species, may potentially have large impacts.
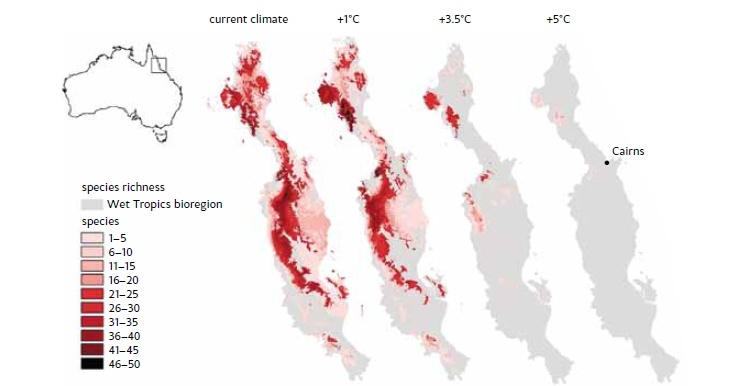 Figure 7.1: As temperatures become warmer, native animals that depend on cooler mountain habitats may be particularly vulnerable, as shown for this example from northern Queensland. The maps indicate the number of considered species now present in the Wet Tropics bioregion under the current climate and those expected with temperature rises of 1°C, 3.5°C and 5°C shown according to the colour code at the left. The impacts of changes in rainfall are not included in this example. Adapted from Williams et al. (2003).
Carbon dioxide affects ecosystems directly, both positively and negatively. On land it enhances growth in some trees and plants, an effect sometimes called ‘CO2 fertilisation’. Absorption of CO2 into the oceans causes ‘ocean acidification’, impeding shell formation by organisms such as corals and causing coral deterioration or death.
Bushfires: The number of extreme fire risk days has grown over the past four decades, particularly in southeast Australia and away from the coast (Figure 7.2). Future hotter and drier conditions, especially in southern Australia, are likely to cause further increases in the number of high fire-risk days and in the length of the fire season. CO2 fertilisation may lead to increased foliage cover and hence increased fuel loads in warm arid environments such as parts of southern Australia. A study of southeast Australia has projected that the number of fire danger days rated at ‘very high’ and above could double by 2050, under high emission climate scenarios. Whether or not this leads to more, or worse, fires, and hence to changes in ecosystems, agriculture and human settlements, will depend on how this risk is managed.
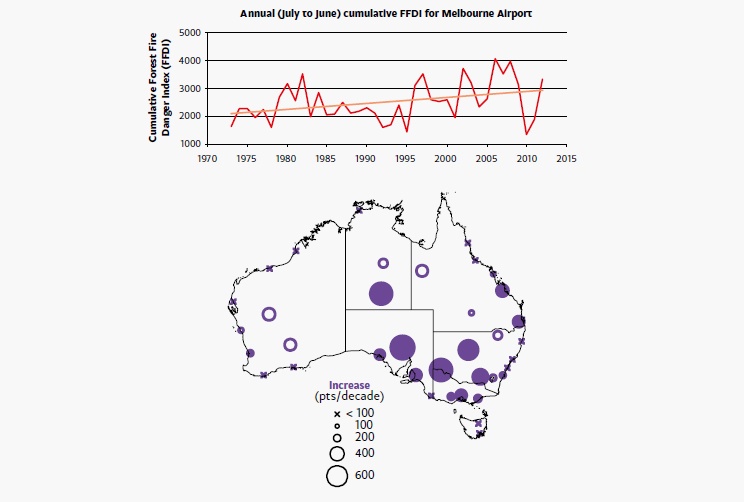 Figure 7.2: In most parts of Australia, the number of extreme fire weather days has increased over the last few decades. The map above shows the trends in average fire weather days (annual cumulative values of the McArthur Forest Fire Danger Index (FFDI)) at 38 climate reference sites. Trends are given in FFDI points per decade and larger circles represent larger trends according to the size code shown below. Filled circles represent trends that are statistically significant. The time series, top, shows the trend in the annual cumulative FFDI at Melbourne Airport. Adapted from Clarke et al (2013).
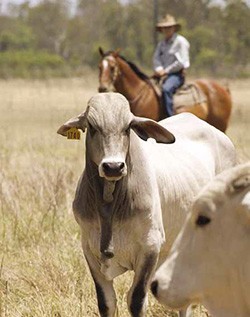 Cattle being mustered on CSIRO’s Belmont Research Station in central Queensland. by CSIRO
Food security: In a non-drought year, around three-quarters of Australian crop and livestock production is exported. The range of adaptation strategies for primary producers to meet the challenge of climate change is large, including breed and seed selection, water conservation and changes in the timing of farm operations. Over the next few decades, some Australian agriculture may benefit from warmer conditions and from the fertilisation effect of increased CO2 in the atmosphere. Looking further into the future, much depends on the effects of climate change on rainfall regimes in Australia’s farming regions. If rainfall increases, climate change may continue to be beneficial for some agriculture. However, for drier, hotter, highervariability climate change scenarios, there are limits to adaptation with anticipated declines in crop yield and livestock production.
Health: Heatwaves are among the highest-impact climate events in terms of human health in Australia. In very hot conditions, people can suffer from heat stress, especially vulnerable individuals such as the sick and elderly. During the heatwave of early 2009 in Victoria, there were 374 more deaths than average for the time of year (Figure 7.3). Warmer temperatures in future will lead to increased occurrences of heatwaves (Figure 5.2 left). Without further adaptation, extremely hot episodes are expected to have the greatest impact on mortality in the hotter north, while in cooler southern Australia there is likely to be an offsetting reduction in the number of cold-season deaths.
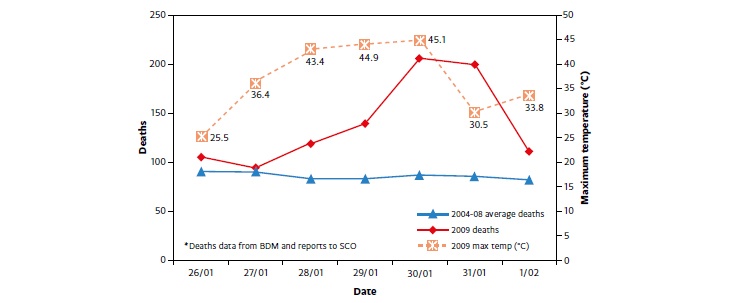 Figure 7.3: The number of deaths in Victoria during the heatwave of 26 January to 1 February 2009 was much higher than the average for the comparable period in 2004-08. Source: Victorian Department of Health report on the January 2009 heatwave, Figure 10.
Warmer temperatures may lead to an increase in diseases spread via water and food such as gastroenteritis. Over the next few decades, Australia is expected to remain malaria-free. However, other vector-borne diseases such as dengue fever, Barmah Forest Virus and Ross River Virus may expand their range, depending on socioeconomic and lifestyle factors related to hygiene, travel frequency and destinations, in addition to climate scenarios. Extreme events also have psychological impacts. Drought is known to cause depression and stress amongst farmers and pastoralists, and this impact may increase over southern Australia as a result of climate change.
 Climate change can have impacts on infrastructure such as electricity and transport networks. V/Line railway, Victoria. Photo: Dermis50
Infrastructure: Climate change can have impacts on infrastructure such as electricity and transport networks. Electricity demand rises sharply during heatwaves because of increased air conditioning. To avoid extensive blackouts there has been investment in generation and network capacity that is only used for a short time. In New South Wales, capacity needed for fewer than 40 hours a year (less than 1% of time) accounts for around 25% of retail electricity bills. In the 2009 heatwave in Melbourne, many rail services were cancelled because rails buckled and air conditioning failed. Coastal inundation and erosion due to sea-level rise, particularly when accompanied by extreme weather events, pose risks to infrastructure.
Around 30,000 km of roads across Australia are at risk from a 1.1 metre sea-level rise, with housing and infrastructure at risk valued at more than $226 billion.
In engineering terms, adapting to some of these risks is straightforward. Perth recently experienced a heatwave more intense than the Melbourne event, but no trains were cancelled on the city’s more modern rail network. However, the costs of adapting infrastructure can be high.
Climate change will interact with the effects of other stresses
The impacts of climate change often act to amplify other stresses. For example, many natural ecosystems are already subject to urban encroachment, fragmentation, deforestation, invasive species, introduced pathogens and pressure on water resources. Some societies suffer warfare and civil unrest, overpopulation, poverty and sinking land in high population river deltas. Multiple stresses do not simply add to each other in complex systems like these; rather, they cascade together in unexpected ways. Therefore, climate change impacts, interacting with other stresses, have the potential to shift some ecosystems and societies into new states with significant consequences for human wellbeing. For moderate levels of climate change, developed countries such as Australia are well placed to manage and adapt to such cascading impacts. However, developing nations, especially the least developed, face risks from projected impacts that may exceed capacities to adapt successfully. As climate change intensifies, especially under high-emission pathways (Question 4), adaptive capacities may be exceeded even in developed countries.
The effects of climate change elsewhere will impact Australia
Human society is now globally interconnected, dependent on intricate supply chains and a finite resource base. The global population now exceeds 7 billion people and is expected to increase to 9.6 billion by 2050; half of all fresh water and almost a quarter of global plant productivity is appropriated for human use; forecast yield gaps for major crops are increasing, especially in developing countries, and some yields may be reaching biophysical limits; 145 million people live within one metre elevation of sea level, with around 72% of these in Asia.
In this interconnected world, many risks to Australia from climate change, and potentially many opportunities, arise from impacts outside our national borders. For example: (1) sea-level rise and extreme events will threaten coastal zones, Pacific small island states, and large urban centres in Asian megadeltas; (2) global food production and trading patterns will change as present-day exporters see production fall, and as new exporters emerge; (3) climate change may exacerbate emerging humanitarian and security issues elsewhere in the world, leading to increased demands on Australia for aid, disaster relief and resettlement.
The further global climate is pushed beyond the envelope of relative stability that has characterised the last several thousand years, the greater becomes the risk of major impacts that will exceed the adaptive capacity of some countries or regions. Australia is a wealthy, healthy and educated society well placed to adapt to climate change and with the capacity to help address the impacts of changing climates elsewhere in the world.
https://www.science.org.au/learning/general-audience/science-climate-change/7-what-are-impacts-of-climate-change
melkior- Posts : 17503
2015-08-09
Re: Trump prošao pokraj buduće nobelovke za mir kao pokraj turskog groblja
by melkior Tue 24 Sep - 23:49
A number of factors prevent more accurate predictions of climate change, and many of these will persist
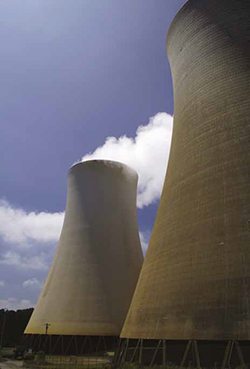 Cooling towers at Loy Yang, a brown coal power station near Traralgon in Victoria. It is one of Australia’s biggest power stations by capacity. Photo:
 While advances continue to be made in our understanding of climate physics and the response of the climate system to increases in greenhouse gases, many uncertainties are likely to persist. The rate of future global warming depends on future emissions, feedback processes that dampen or reinforce disturbances to the climate system, and unpredictable natural influences on climate like volcanic eruptions. Uncertain processes that will affect how fast the world warms for a given emissions pathway are dominated by cloud formation, but also include water vapour and ice feedbacks, ocean circulation changes, and natural cycles of greenhouse gases. Although information from past climate changes largely corroborates model calculations, this is also uncertain due to inaccuracies in the data and potentially important factors about which we have incomplete information.
It is very difficult to tell in detail how climate change will affect individual locations, particularly with respect to rainfall. Even if a global change were broadly known, its regional expression would depend on detailed changes in wind patterns, ocean currents, plants, and soils.
The climate system can throw up surprises: abrupt climate transitions have occurred in Earth’s history, the timing and likelihood of which cannot generally be foreseen with confidence.
Despite these uncertainties, there is near-unanimous agreement among climate scientists that human-caused global warming is real
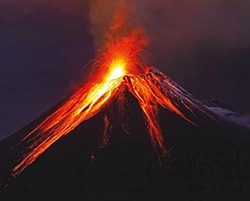 Volcanic eruptions can exert unpredictable natural influences on climate. Photo:
 It is known that human activities since the industrial revolution have sharply increased greenhouse gas concentrations; these gases have a warming effect; warming has been observed; the calculated warming is comparable to the observed warming; and continued reliance on fossil fuels would lead to greater impacts in the future than if this were curtailed. This understanding represents the work of thousands of experts over more than a century, and is extremely unlikely to be altered by further discoveries.
Uncertainty works in both directions: future climate change could be greater or less than present-day best projections
Any action involves risk if its outcomes cannot be foreseen and the possibility of significant harm cannot be ruled out. Uncertainty about the climate system does not decrease risk associated with greenhouse gas emissions, because it works in both directions: climate change could prove to be less severe than current estimates, but could also prove to be worse.
Even if future changes from greenhouse gas emissions are at the low end of the expected range, a high-emissions pathway would still be enough to take the planet to temperatures it has not seen for many millions of years, well before humans evolved. In this situation, there can be no assurance that significant harm would not occur.
Science has an important role in identifying and resolving uncertainties, and informing public policy on climate change
 Helping to test NASA’s earth surface imaging satellite Earth Observing-1 (EO-1), at Lake Frome, South Australia. EO-1 collects much more detailed information about the earth’s surface than previous satellite missions. by CSIRO Atmospheric Research
All societies routinely make decisions to balance or minimise risk with only partial knowledge of how these risks will play out. This is true in defence, finance, the economy and many other areas. Societies have faced and made choices about asbestos, lead, CFCs, and tobacco. Although each case has unique aspects, all carried scientifically demonstrated but hard-to-quantify risks, and were contentious, in common with climate change.
Mechanisms have been put in place nationally and internationally to facilitate scientific input into decision making. In particular, the international Intergovernmental Panel on Climate Change (IPCC) has prepared thorough, ‘policy-neutral but policy-relevant’ assessments of the state of knowledge and uncertainties of the science since 1990, with the most recent assessment completed in 2014. Australian scientists have made a major contribution to the quality and integrity of these international IPCC assessments.
9. What does science say about options to address climate change?
 Adjusting the Solar Thermal Dish at the Lucas Heights Facility, NSW, which is investigating renewable non-carbon energy options. by North Sullivan Photography
Societies face choices about future climate change
Managing the risks from future human-induced climate change will necessarily be based on some combination of four broad strategies:
- Emissions reduction: reducing climate change by reducing greenhouse gas emissions.
- Sequestration: removing carbon dioxide (CO2) from the atmosphere into permanent geological, biological or oceanic reservoirs.
- Adaptation: responding to and coping with climate change as it occurs, in either a planned or unplanned way.
- Solar geoengineering: large-scale engineered modifications to limit the amount of sunlight reaching the earth, in an attempt to offset the effects of ongoing greenhouse gas emissions.
Each embodies a large suite of specific options, with associated risks, costs and benefits. The four strategies can affect each other: for example, doing nothing to reduce emissions would require increased expenditure to adapt to climate change, and increased chances of future resort to geoengineering.
Options for emissions reduction centre on carbon dioxide
CO2 is the dominant contributor to human-induced climate change (Question 3). If the world adopts a target of keeping warming to less than 2°C above preindustrial temperatures, then future cumulative CO2 emissions would need to be capped at around 30 years worth of current emissions (Question 4). Estimates of the amount of carbon in accessible fossil fuel reserves vary, but all agree that these reserves are at least several times larger than the carbon cap for a 2°C warming limit. Therefore, such a carbon cap, or even a significantly more lenient one, can only be met if a large fraction of available fossil fuel reserves remains unburned or if the CO2 released is captured and permanently sequestered (see below).
Methane, nitrous oxide, halocarbon gases and black-carbon aerosols also have warming effects (Question 3), and reductions in their emissions would reduce the near-term warming rate. However, their combined contributions to warming over the longer term would be much less than that of CO2, so these reductions alone could not meet a goal such as a 2°C warming limit.
There are many ways to reduce emissions of CO2 and other warming agents, including shifting energy supply away from dependence on fossil fuels; energy efficiency in the domestic, industrial, service and transport sectors; reductions in overall demand through better system design; and efficient reductions in emissions of methane, nitrous oxide, halocarbon gases and black-carbon aerosols. Uptake of all of these options is happening now, and multiple studies have shown that they can be expanded effectively.
 Capital Windfarm at Lake George, NSW. by Claudio Goodman
Other options are available but have significant collateral effects
In principle there are two interventions that could relax constraints on future emissions, but with significant uncertainties, risks, costs, and/or limitations. One would be to remove CO2 from combustion exhaust streams or from the air, and sequester it underground, in the deep ocean, or in trees or the soil. The places used to store this carbon need to hold it for many centuries. Such carbon sequestration strategies face logistical, economic and technical challenges.
The other possible intervention would be to reduce Earth’s net absorption of sunlight, for example by generating a stratospheric aerosol layer or placing shields in space. While this could offset the surface warming caused by increasing greenhouse gases, it would do nothing to stop ocean acidification, would need to be maintained in perpetuity, and would carry multiple risks of adverse additional consequences on a global scale. Our current understanding of the climate system does not enable us to fully understand the implications of such actions.
Some climate change is inevitable and adaptation will be needed
Under any realistic future emissions scenario (Question 4), some additional global warming is inevitable and will require adaptation measures. Indeed, adaptation is needed now in response to climate change that has occurred already. The more CO2 that is emitted in the next few decades, the stronger the adaptation measures that will be needed in future. There are limits to the adaptive capacities of both ecosystems and human societies, particularly in less developed regions. Thus, the decisions we make today on emissions will affect not only the future requirements for and costs of adaptation measures, but also their feasibility.
Decisions are informed by climate science, but fundamentally involve ethics and value judgements
As our society makes choices about managing the risks and opportunities associated with climate change, there is an important role for objective scientific information on the consequences of alternative pathways. Choices also hinge on ethical frameworks and value judgements about the wellbeing of people, economies and the environment. The role of climate science is to inform decisions by providing the best possible knowledge of climate outcomes and the consequences of alternative courses of action.
https://www.science.org.au/learning/general-audience/science-climate-change/9-what-does-science-say-about-climate-change-options
melkior- Posts : 17503
2015-08-09
Re: Trump prošao pokraj buduće nobelovke za mir kao pokraj turskog groblja
by melkior Tue 24 Sep - 23:51

About
Working Group:
- Lisa Alexander
- Ian Allison AO (co-chair)
- Michael Bird
- John Church FAA FTSE
- Matthew England FAA
- Jean Palutikof
- Michael Raupach FAA FTSE (co-chair)
- Steven Sherwood
- Susan Wijffels
Oversight Committee:
- Graham Farquhar AO FAA FRS
- Roger Gifford
- Andrew Gleadow FAA
- Kurt Lambeck AO FAA FRS
- Trevor McDougall FAA FRS
- Graeme Pearman AM FAA FTSE
- Steve Rintoul FAA
- John Zillman AO FAA FTSE (chair)
Acknowledgments:
- Hedda Ransan-Cooper (scientific editing)
- Stephen Pincock (communication consultant)
- Louise Bell
- Jules Kajtar
- Jana Sillmann (figure preparation)
The Australian Academy of Science provides independent, authoritative and influential scientific advice, promotes international scientific engagement, builds public awareness and understanding of science, and champions, celebrates and supports excellence in Australian science.
https://www.science.org.au/
melkior- Posts : 17503
2015-08-09
Re: Trump prošao pokraj buduće nobelovke za mir kao pokraj turskog groblja
by prckov Wed 25 Sep - 8:35
ajd kad se skines sa aparata polako svojim argumentima I svojim mozgom objasni kako to co2 utice na klimatske promjene
kolko ga ima u atmosferi, koliko je optimalan odnos u atmosferi za biljni svijet,
jel kolicina co2 u atmosferi u kontinuiranom padu ili porastu
propagandne pamflete zalijepi sebi na supak sto se mene tice
ajd nesto iz svoje glave proprdi konacno
_________________
It was always the women, and above all the young ones, who were the most bigotet adherents of the party, the swallowers of slogans, the amateur spies and nosers-out of unortodoxy.
Orwell 1984
prckov- Posts : 34555
2014-04-18
Re: Trump prošao pokraj buduće nobelovke za mir kao pokraj turskog groblja
by Šandor Winnetou Wed 25 Sep - 9:28
i još vjerojatnije lezba, okriviti će muški rod za sva moguća i nemoguća sranjaNoor wrote:jednog dana bit će dobra feministicaprckov wrote:kad su ljevicari imali obrazamarcellus wrote:jadno to dijete što joj rade
u australiji su nastavnici od osnovne do fakulteta digli sve na protest
oš se kladit?

_________________


Šandor Winnetou-

Posts : 19785
2017-12-31
Re: Trump prošao pokraj buduće nobelovke za mir kao pokraj turskog groblja
by Šandor Winnetou Wed 25 Sep - 9:32
mogla bi kod frljića glumatat bez problemakaya wrote:Dobro ovo plakanje i ton je vježbala , i izgleda kao da na silu plače...što izgleda kao da je sa naše glumačke akademijeNoor wrote:rma daj, mala je jezivi psycho i takvu je iskoriste za političke svrhe
_________________
Šandor Winnetou-
Posts : 19785
2017-12-31
Sponsored content
Page 9 of 12 • 1, 2, 3 ... 8, 9, 10, 11, 12 ![]()
» Kad pokraj bauštele vikneš: “Zemljače!”, svi se okreću
» Pokraj Zagreba proizvodit će se dijelovi za Boing,Airbus
» Nobelovke posjetile kamp u Brodu: 'Ne smijemo dopustiti da se napad u Parizu iskoristi za poticanje ksenofobije'
» Rusi i u Uljaniku, VTB će pratiti buduće vlasnike